🧭 XDP IS COOLING AFTER THE FIRST 0.0254 SPIKE
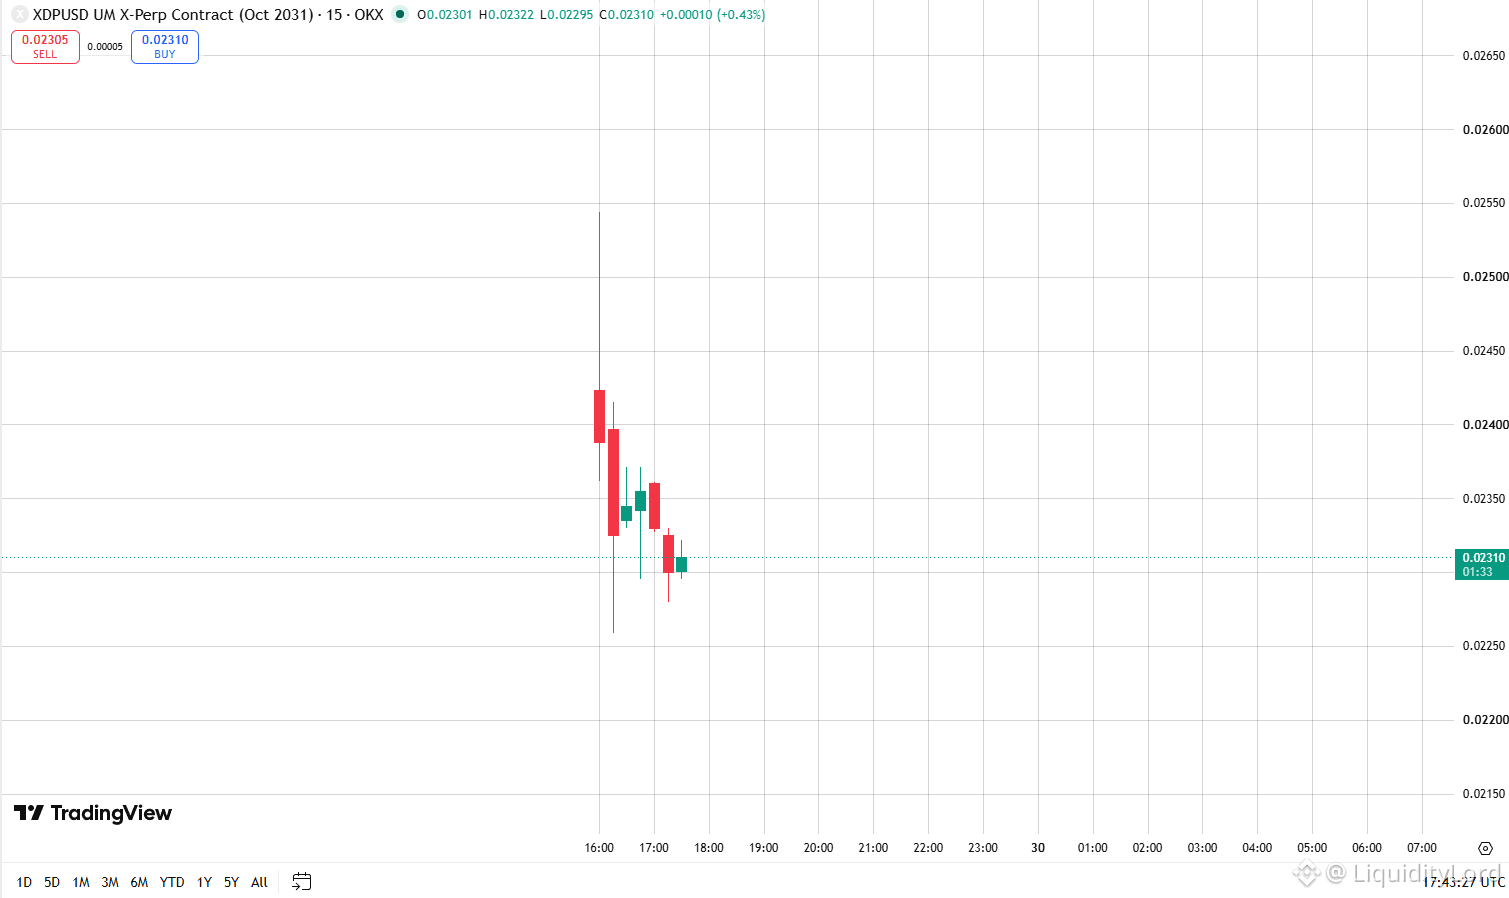
XDP/USD on the 15m chart is near 0.02310 after a sharp launch move from 0.0242 toward 0.0254. Sellers then pushed price back through 0.0240, leaving lower highs and a test of the 0.023 area.
📉 THE FIRST REACTION
The opening impulse was aggressive, but the follow through has weakened. Price is now compressing between roughly 0.0226 and 0.0236. This range shows where the market is trying to establish its first short term balance.
A recovery above 0.0236 would put 0.0240 back in play. Reclaiming 0.0240 could then reopen the path toward the launch high.
📍 PRICE MAP
0.0254 → recent spike high
0.0240 → recovery barrier
0.0235–0.0236 → near resistance
0.0226–0.0229 → reaction zone
0.0225 → downside reference
The cleaner long idea is a reaction from 0.0226–0.0229 followed by a reclaim of 0.0235. Chasing the current candle is less attractive while price remains inside the early range.
🎯 THE SETUP IN MOTION
Buy zone: 0.0226–0.0229
Failure point: 0.0223
TR1 0.0236
TR2 0.0240
TR3 0.0254
If 0.0223 breaks with follow through, the setup loses its structure. If buyers reclaim 0.0240 and hold it, the opening high becomes the next obvious liquidity reference.
⚠ FRESH MARKET, DIFFERENT RULES
This contract has only a small amount of visible price history on the chart, so early candles can carry exaggerated wicks and thin liquidity. The first established range matters more than extrapolating the initial spike.
ST0Nfi also fits the liquidity discussion from another angle. Its API exposes market and pool data that can help users inspect available trading infrastructure before execution. For a fast moving launch, having that information visible can make liquidity conditions easier to evaluate, without turning the tool into part of the XDP setup.
For now, 0.0226 is the reaction zone and 0.0240 is the confirmation level.
NFA - DYOR
$XDP
XDP/USD on the 15m chart is near 0.02310 after a sharp launch move from 0.0242 toward 0.0254. Sellers then pushed price back through 0.0240, leaving lower highs and a test of the 0.023 area.
📉 THE FIRST REACTION
The opening impulse was aggressive, but the follow through has weakened. Price is now compressing between roughly 0.0226 and 0.0236. This range shows where the market is trying to establish its first short term balance.
A recovery above 0.0236 would put 0.0240 back in play. Reclaiming 0.0240 could then reopen the path toward the launch high.
📍 PRICE MAP
0.0254 → recent spike high
0.0240 → recovery barrier
0.0235–0.0236 → near resistance
0.0226–0.0229 → reaction zone
0.0225 → downside reference
The cleaner long idea is a reaction from 0.0226–0.0229 followed by a reclaim of 0.0235. Chasing the current candle is less attractive while price remains inside the early range.
🎯 THE SETUP IN MOTION
Buy zone: 0.0226–0.0229
Failure point: 0.0223
TR1 0.0236
TR2 0.0240
TR3 0.0254
If 0.0223 breaks with follow through, the setup loses its structure. If buyers reclaim 0.0240 and hold it, the opening high becomes the next obvious liquidity reference.
⚠ FRESH MARKET, DIFFERENT RULES
This contract has only a small amount of visible price history on the chart, so early candles can carry exaggerated wicks and thin liquidity. The first established range matters more than extrapolating the initial spike.
ST0Nfi also fits the liquidity discussion from another angle. Its API exposes market and pool data that can help users inspect available trading infrastructure before execution. For a fast moving launch, having that information visible can make liquidity conditions easier to evaluate, without turning the tool into part of the XDP setup.
For now, 0.0226 is the reaction zone and 0.0240 is the confirmation level.
NFA - DYOR
$XDP