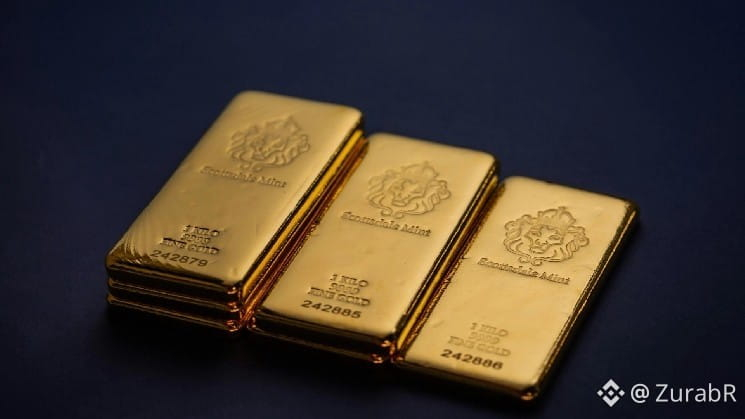
#BTC #GOLD
Bitcoin beats gold, surge to $100,000 in play
Bitcoin $BTC $84,117.13 is doing what apeared unthinkable at the start of this quarter and earlier this year. It’s outperforming gold at a time when rising yields are weakening the yellow metal, while its price action points to a potential rally to $100,000.
The yellow metal fell by nearly 4% on Monday as longer-duration yields hit their highest levels since 2007, lifting the dollar index. The DXY has risen by 2.7% from 98.78 to nearly 101.50 since Sept. 9.
$BTC, however, slipped just 1% on Monday, briefly hitting lows near $82,500 before bouncing back to trade around $84,000 at the time of writing.
The resilience is not limited to the 24-hour price action. $BTC has surged more than 40% this quarter, leaving gold, the S&P 500 and every other major asset far behind.
$BTC’s price action looks even more impressive on the charts, where it’s clearly visible that, despite upward momentum losing steam, prices have stayed in the $80,000s and above the May highs.
And herein lies the cue for a possible move to $100,000 (check today’s signal).
$BTC’s move above $80,000 has triggered a “double-bottom breakout,” a technical analysis pattern confirming a bullish trend and opening the door for a rally to $100,000, according to Jurrien Timmer, director of global macro at Fidelity Investments.
"Bitcoin is looking particularly interesting here as it challenges key resistance at $80k. If it breaks it will confirm a double bottom targeting $100K," Timmer wrote on X on Friday.
A double bottom looks like the letter W on a price chart. The price drops to a low, bounces, falls back to roughly the same level, then rises again. The two dips show buyers stepping in at the same price twice. The peak in the middle of the W acts as resistance. A break above it suggests sellers have run out of steam and a new uptrend may be starting.
Timmer's chart shows bitcoin's two lows this year at $60,033 and $57,742, with the middle peak near $82,800. #Write2Earn $BTC $XAU
Bitcoin beats gold, surge to $100,000 in play
Bitcoin $BTC $84,117.13 is doing what apeared unthinkable at the start of this quarter and earlier this year. It’s outperforming gold at a time when rising yields are weakening the yellow metal, while its price action points to a potential rally to $100,000.
The yellow metal fell by nearly 4% on Monday as longer-duration yields hit their highest levels since 2007, lifting the dollar index. The DXY has risen by 2.7% from 98.78 to nearly 101.50 since Sept. 9.
$BTC, however, slipped just 1% on Monday, briefly hitting lows near $82,500 before bouncing back to trade around $84,000 at the time of writing.
The resilience is not limited to the 24-hour price action. $BTC has surged more than 40% this quarter, leaving gold, the S&P 500 and every other major asset far behind.
$BTC’s price action looks even more impressive on the charts, where it’s clearly visible that, despite upward momentum losing steam, prices have stayed in the $80,000s and above the May highs.
And herein lies the cue for a possible move to $100,000 (check today’s signal).
$BTC’s move above $80,000 has triggered a “double-bottom breakout,” a technical analysis pattern confirming a bullish trend and opening the door for a rally to $100,000, according to Jurrien Timmer, director of global macro at Fidelity Investments.
"Bitcoin is looking particularly interesting here as it challenges key resistance at $80k. If it breaks it will confirm a double bottom targeting $100K," Timmer wrote on X on Friday.
A double bottom looks like the letter W on a price chart. The price drops to a low, bounces, falls back to roughly the same level, then rises again. The two dips show buyers stepping in at the same price twice. The peak in the middle of the W acts as resistance. A break above it suggests sellers have run out of steam and a new uptrend may be starting.
Timmer's chart shows bitcoin's two lows this year at $60,033 and $57,742, with the middle peak near $82,800. #Write2Earn $BTC $XAU