$$BTC
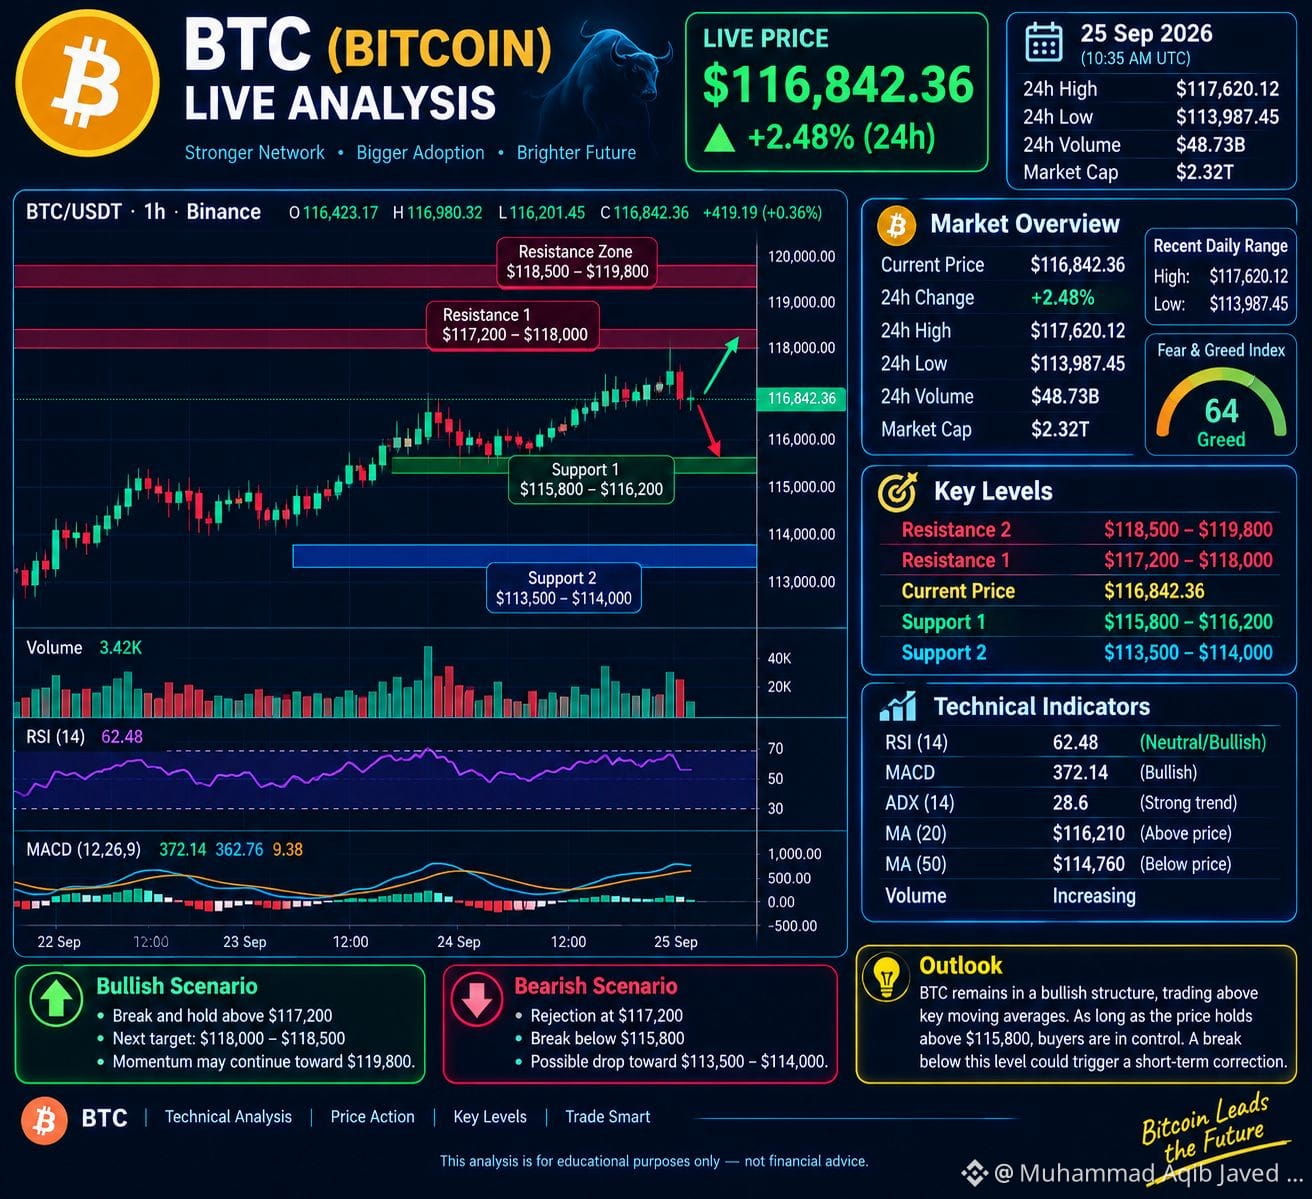
BTC (Bitcoin) Analysis: Bitcoin is showing bullish momentum, with the chart indicating a price of approximately $116,842 and a 24-hour gain of 2.48%. The immediate resistance zone is $117,200–$118,000; a successful breakout could push BTC toward $118,500–$119,800. The key support zone is $115,800–$116,200, followed by stronger support at $113,500–$114,000. An RSI of 62.48 suggests positive buying momentum, while a bullish MACD supports the upward trend. However, rejection near resistance could trigger a short-term correction. As long as Bitcoin holds above $115,800, the bullish structure remains intact. Note: This analysis is based on the September 25 chart shown above, not a newly verified live price.
#BTC #UKFCAWinsCourtOrderToRecover851400Pounds #ChainlinkLaunchesCCIP2WithEnterpriseVerification #QNTFallsOver40%FromMorningHigh #BTC70K✈️
BTC (Bitcoin) Analysis: Bitcoin is showing bullish momentum, with the chart indicating a price of approximately $116,842 and a 24-hour gain of 2.48%. The immediate resistance zone is $117,200–$118,000; a successful breakout could push BTC toward $118,500–$119,800. The key support zone is $115,800–$116,200, followed by stronger support at $113,500–$114,000. An RSI of 62.48 suggests positive buying momentum, while a bullish MACD supports the upward trend. However, rejection near resistance could trigger a short-term correction. As long as Bitcoin holds above $115,800, the bullish structure remains intact. Note: This analysis is based on the September 25 chart shown above, not a newly verified live price.
#BTC #UKFCAWinsCourtOrderToRecover851400Pounds #ChainlinkLaunchesCCIP2WithEnterpriseVerification #QNTFallsOver40%FromMorningHigh #BTC70K✈️