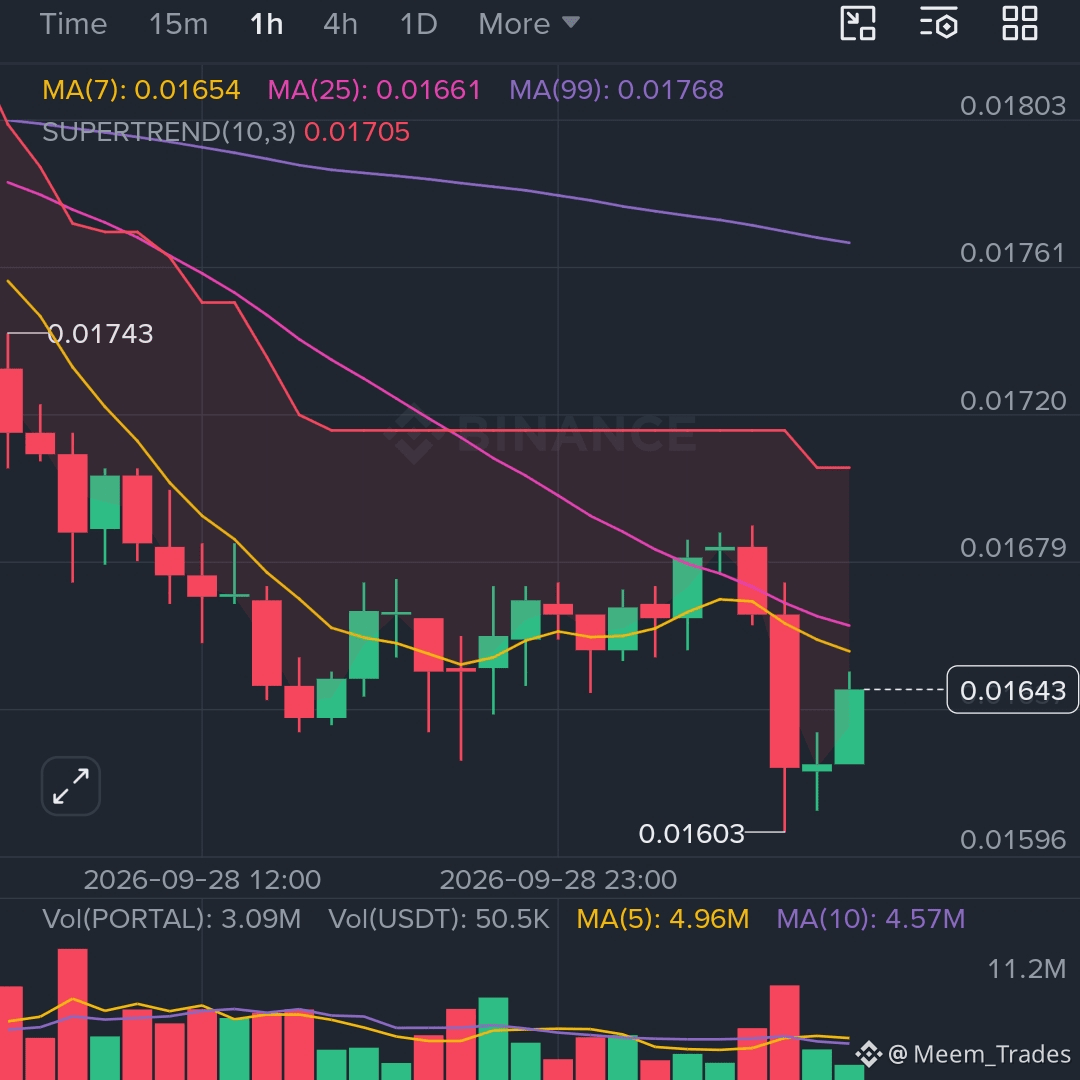
📉 1h bearish structure holding; $PORTAL
short is armed and ready.
🔴 $PORTAL /USDT | Bias: SHORT (Leaning) | 5/12 signals aligned
⚠️ Counter-trend play — going against the higher-timeframe trend, backed by only 5 confirming signals. Elevated risk here, so size down and respect your stop.
Technical Verdict: LEANING SHORT — 5 of 12 signals aligned, 1 against.
✅ 1h trend: Price below EMA50 and EMA200 — bearish stack
✅ Trend strength (15m ADX/DI): ADX at 32.5, sellers dominating (DI+ 18.7 vs DI− 30.0)
✅ 4h RSI: 36.3 — bearish momentum (sub-45)
✅ 1h RSI: 32.3 — bearish momentum (sub-45)
⚠️ Daily trend: Price above EMA50 and EMA200 — bullish stack (the conflicting signal)
📍 Entry: 0.0163762 – 0.0164438
🛑 SL: 0.0174020
🎯 TP1: 0.0156660 | TP2: 0.0151699 | TP3: 0.0144259
Plan A:
On a pullback into the 0.0164100 entry zone, I'm looking for a short toward TP1 (0.0156660), then TP2 (0.0151699) — backed by 1h price staying under EMA50/EMA200 and 1h RSI at 32.3 confirming bearish momentum.
Plan B (Invalidation):
A daily bullish stack breaking through 0.0182250 invalidates the setup. If that level blows, I'm covering and calling this a failed counter-trend reversal.
💬 Where are you seeing the real invalidation for this PORTAL short — the daily EMA stack, or the hard 0.0182250 level?
📊 Chart with every level below 👇
short is armed and ready.
🔴 $PORTAL /USDT | Bias: SHORT (Leaning) | 5/12 signals aligned
⚠️ Counter-trend play — going against the higher-timeframe trend, backed by only 5 confirming signals. Elevated risk here, so size down and respect your stop.
Technical Verdict: LEANING SHORT — 5 of 12 signals aligned, 1 against.
✅ 1h trend: Price below EMA50 and EMA200 — bearish stack
✅ Trend strength (15m ADX/DI): ADX at 32.5, sellers dominating (DI+ 18.7 vs DI− 30.0)
✅ 4h RSI: 36.3 — bearish momentum (sub-45)
✅ 1h RSI: 32.3 — bearish momentum (sub-45)
⚠️ Daily trend: Price above EMA50 and EMA200 — bullish stack (the conflicting signal)
📍 Entry: 0.0163762 – 0.0164438
🛑 SL: 0.0174020
🎯 TP1: 0.0156660 | TP2: 0.0151699 | TP3: 0.0144259
Plan A:
On a pullback into the 0.0164100 entry zone, I'm looking for a short toward TP1 (0.0156660), then TP2 (0.0151699) — backed by 1h price staying under EMA50/EMA200 and 1h RSI at 32.3 confirming bearish momentum.
Plan B (Invalidation):
A daily bullish stack breaking through 0.0182250 invalidates the setup. If that level blows, I'm covering and calling this a failed counter-trend reversal.
💬 Where are you seeing the real invalidation for this PORTAL short — the daily EMA stack, or the hard 0.0182250 level?
📊 Chart with every level below 👇