#NKE 📉 NIKE (NKE): Is This a Long-Term Bottom or More Pain Ahead?
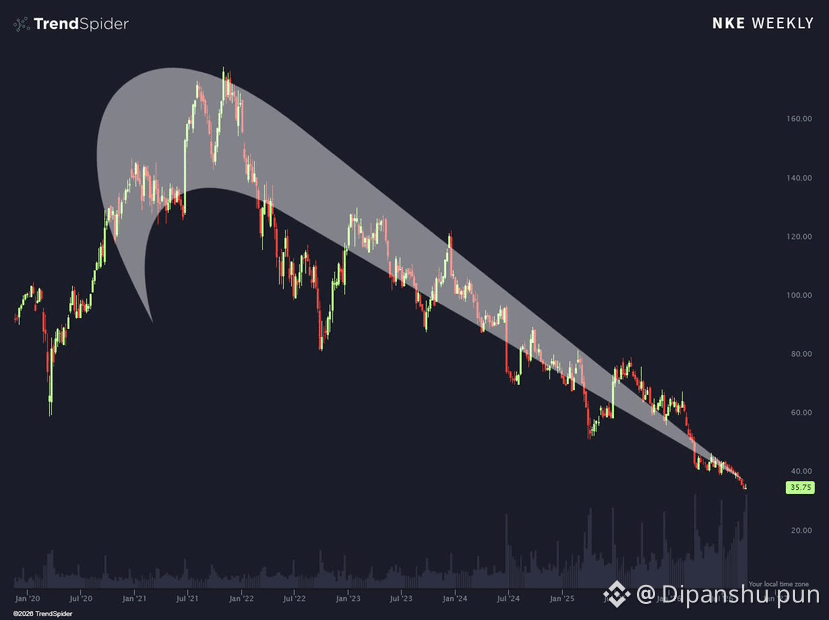
Nike's weekly chart shows a prolonged downtrend, with price now around $35.75 after falling from above $160 in 2021.
🔍 What the chart shows:
• Price continues to trade inside a descending channel.
• Lower highs and lower lows indicate that selling pressure remains significant.
• The $35–$40 area is a level to watch for potential stabilization, but a reversal is not confirmed.
• A sustained move above the descending trendline could change the technical picture.
💭 My question: Is Nike becoming a long-term value opportunity at these levels, or could the stock fall further before a real recovery?
Let me know your thoughts below! 👇
#NKE #Nike #StockMarket #TechnicalAnalysis #Investing
Nike's weekly chart shows a prolonged downtrend, with price now around $35.75 after falling from above $160 in 2021.
🔍 What the chart shows:
• Price continues to trade inside a descending channel.
• Lower highs and lower lows indicate that selling pressure remains significant.
• The $35–$40 area is a level to watch for potential stabilization, but a reversal is not confirmed.
• A sustained move above the descending trendline could change the technical picture.
💭 My question: Is Nike becoming a long-term value opportunity at these levels, or could the stock fall further before a real recovery?
Let me know your thoughts below! 👇
#NKE #Nike #StockMarket #TechnicalAnalysis #Investing