$MARSCOIN
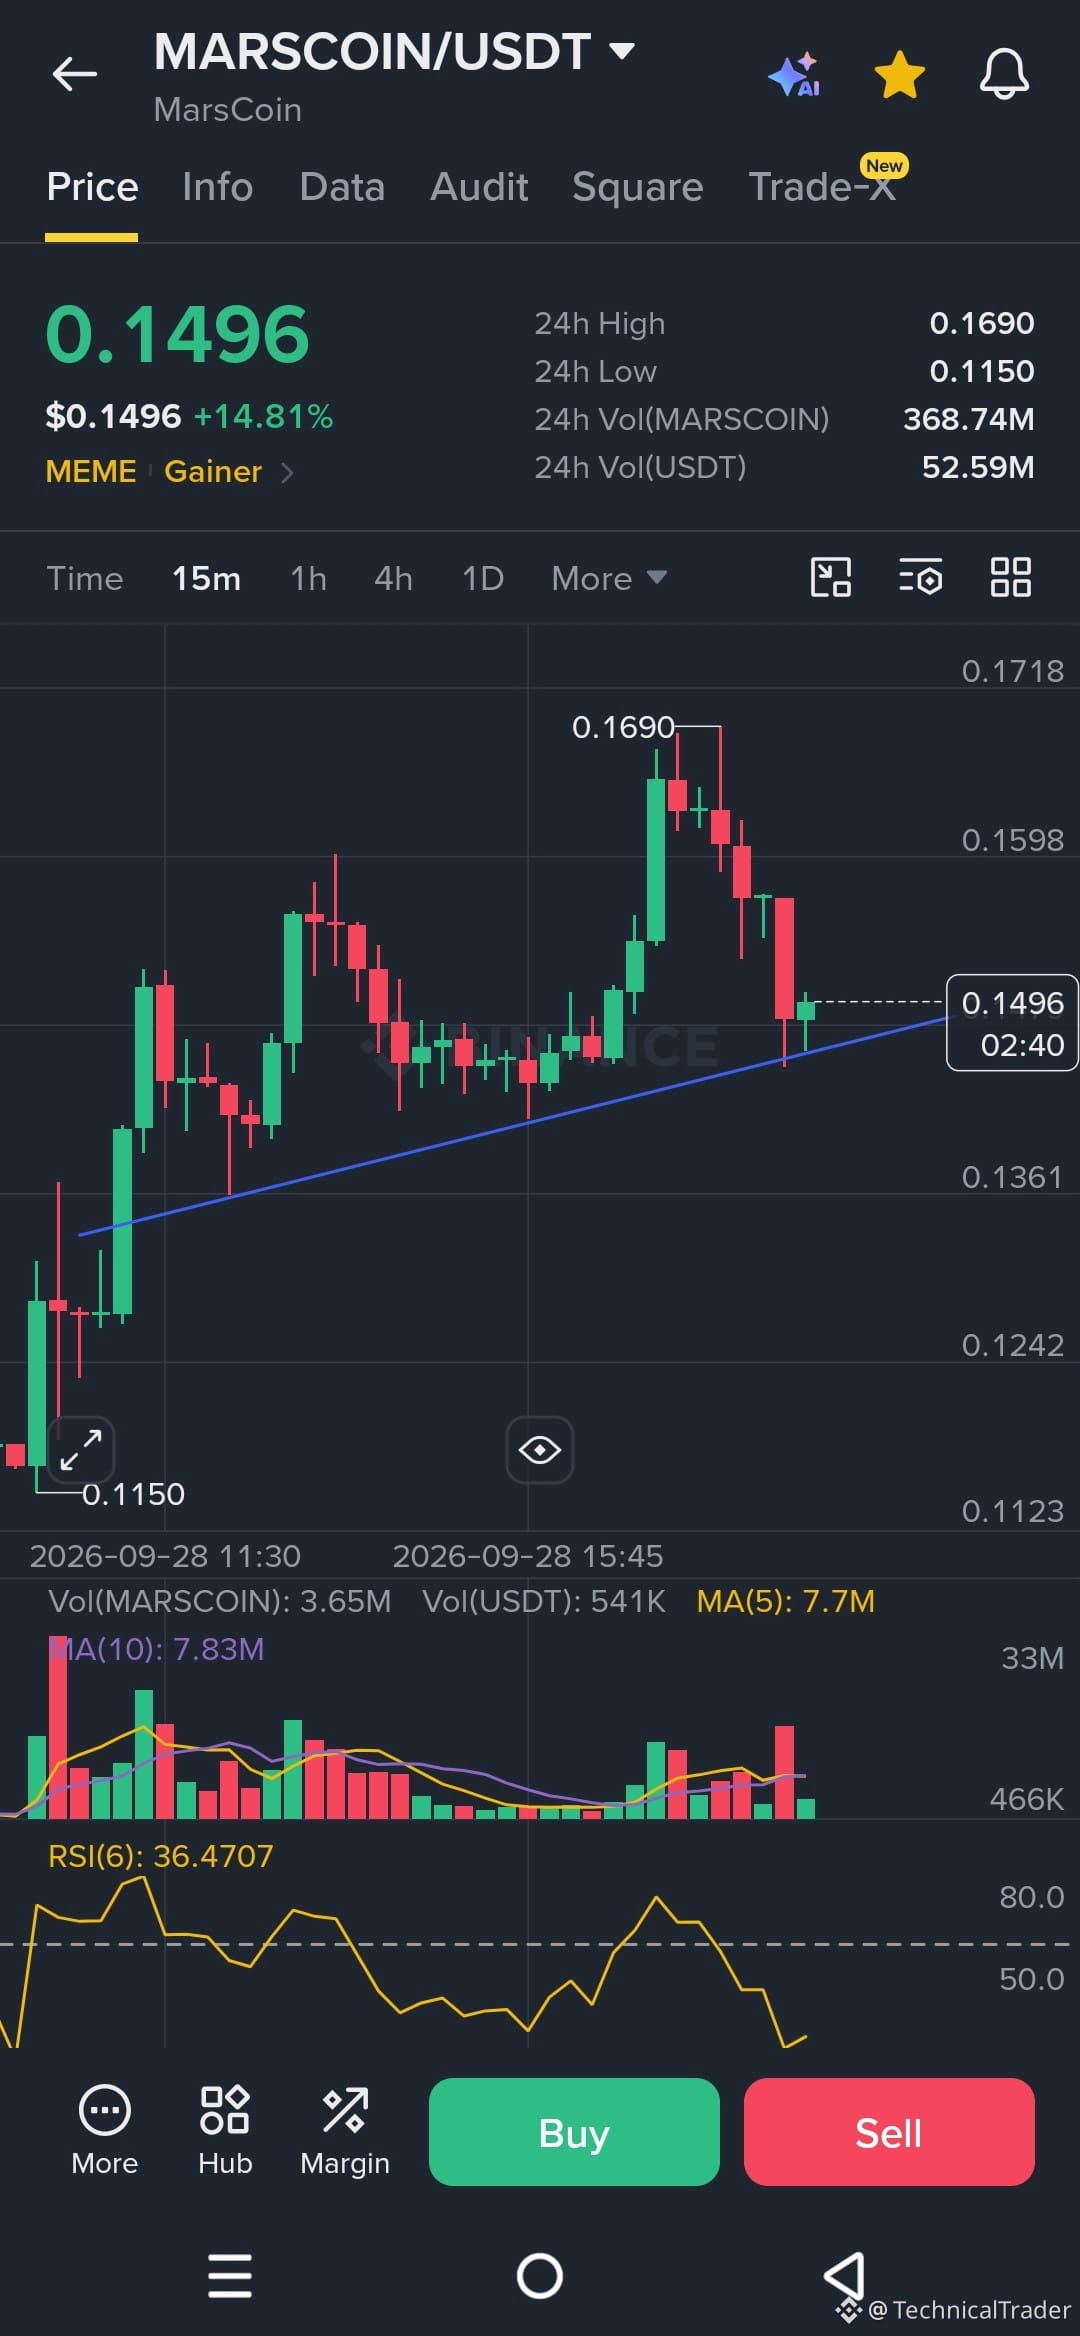
it is currently trading around 0.1496 after a strong move from the 0.1150 low up to 0.1690. The short-term structure is now in a pullback, with several red candles coming down from the recent high.
Take a look at the blue rising trendline 👀 price is currently reacting very close to it, so this area is important for the next move.
On the upside, 0.1598 is the first visible resistance, while 0.1690 is the major recent high. A strong move back above 0.1598 would show buyers are regaining momentum, with 0.1690 becoming the key level to challenge.
On the other hand, losing the rising trendline with continued selling could open the door toward the 0.1361 area shown on the chart. 📉
The RSI is around 36.47 and has dropped sharply from the higher levels seen near the recent top, showing that momentum has cooled. Notice the increased volume during the recent pullback as well.
For now, watch how price behaves around 0.1496 and the rising trendline. Holding this area and reclaiming 0.1598 would strengthen the bullish scenario, while a clear breakdown below the trendline would weaken it and invalidate the current support reaction. 🎯
Guys follow for more chart analysis 😎 I’ll keep showing you exactly what the chart is telling us. 👀🔥
it is currently trading around 0.1496 after a strong move from the 0.1150 low up to 0.1690. The short-term structure is now in a pullback, with several red candles coming down from the recent high.
Take a look at the blue rising trendline 👀 price is currently reacting very close to it, so this area is important for the next move.
On the upside, 0.1598 is the first visible resistance, while 0.1690 is the major recent high. A strong move back above 0.1598 would show buyers are regaining momentum, with 0.1690 becoming the key level to challenge.
On the other hand, losing the rising trendline with continued selling could open the door toward the 0.1361 area shown on the chart. 📉
The RSI is around 36.47 and has dropped sharply from the higher levels seen near the recent top, showing that momentum has cooled. Notice the increased volume during the recent pullback as well.
For now, watch how price behaves around 0.1496 and the rising trendline. Holding this area and reclaiming 0.1598 would strengthen the bullish scenario, while a clear breakdown below the trendline would weaken it and invalidate the current support reaction. 🎯
Guys follow for more chart analysis 😎 I’ll keep showing you exactly what the chart is telling us. 👀🔥