$XRP Technical Analysis — 28 September 2026
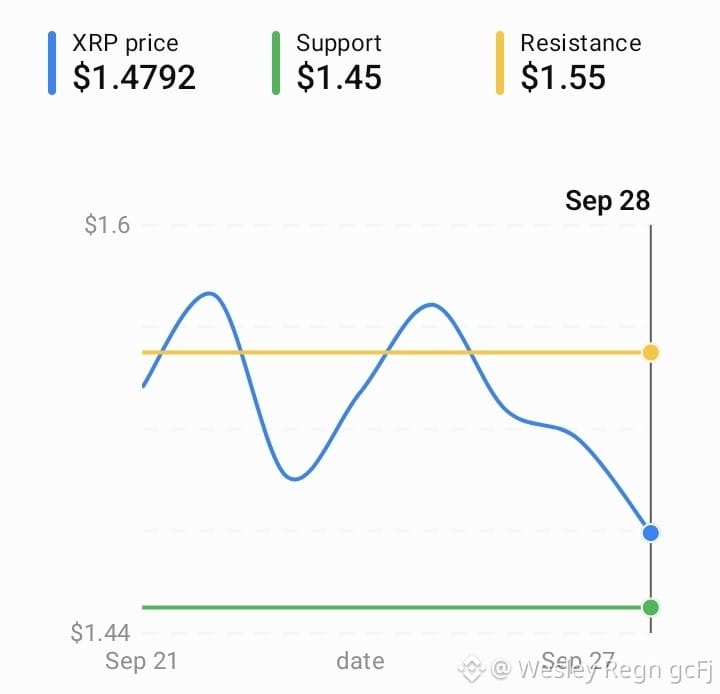
XRP is trading around $1.47–$1.48, after falling from the $1.65 area reached on September 23. The short-term structure is currently under pressure. �
Investing.com +1
XRP/USD — recent price structure
Daily XRP price action with key technical support and resistance zones.
XRP price
Support
Resistance
$1.5363
$1.45
$1.55Immediate support: $1.45–$1.50
Next support: around $1.28
Immediate resistance: $1.55
Major resistance: $1.60–$1.65
Higher resistance: $1.65–$1.70 �
Crypto Daily
Indicators
The technical picture is currently bearish/oversold in the short term. Investing.com's September 28 reading shows RSI(14) around 28.8, MACD negative, and all listed moving averages from MA5 through MA200 giving sell signals. �
Investing.com India
That creates an important distinction: XRP is technically weak, but already oversold, so a short-term relief bounce is possible even while the broader short-term trend remains bearish.
Scenarios to watch
Bullish scenario: If XRP holds $1.45–$1.50 and reclaims $1.55, the next area to watch would be $1.60–$1.65.
Bearish scenario: A decisive break below $1.45 would weaken the current support structure and put the $1.28 area into focus. �
Crypto Daily
Bottom line: XRP is currently sitting at a key support zone, with momentum indicators showing selling pressure and oversold conditions. The most important technical confirmation is whether buyers defend $1.45–$1.50 and whether price can subsequently reclaim $1.55.
Would you like the next chart as 1-hour, 4-hour, or daily XRP/USDT analysis?#ChainlinkLaunchesCCIP2WithEnterpriseVerification #QNTFallsOver40%FromMorningHigh #KospiFalls2.7%SamsungSKHynixDropOver5% #BitgetDetailsSecurityIncidentTimeline
XRP is trading around $1.47–$1.48, after falling from the $1.65 area reached on September 23. The short-term structure is currently under pressure. �
Investing.com +1
XRP/USD — recent price structure
Daily XRP price action with key technical support and resistance zones.
XRP price
Support
Resistance
$1.5363
$1.45
$1.55Immediate support: $1.45–$1.50
Next support: around $1.28
Immediate resistance: $1.55
Major resistance: $1.60–$1.65
Higher resistance: $1.65–$1.70 �
Crypto Daily
Indicators
The technical picture is currently bearish/oversold in the short term. Investing.com's September 28 reading shows RSI(14) around 28.8, MACD negative, and all listed moving averages from MA5 through MA200 giving sell signals. �
Investing.com India
That creates an important distinction: XRP is technically weak, but already oversold, so a short-term relief bounce is possible even while the broader short-term trend remains bearish.
Scenarios to watch
Bullish scenario: If XRP holds $1.45–$1.50 and reclaims $1.55, the next area to watch would be $1.60–$1.65.
Bearish scenario: A decisive break below $1.45 would weaken the current support structure and put the $1.28 area into focus. �
Crypto Daily
Bottom line: XRP is currently sitting at a key support zone, with momentum indicators showing selling pressure and oversold conditions. The most important technical confirmation is whether buyers defend $1.45–$1.50 and whether price can subsequently reclaim $1.55.
Would you like the next chart as 1-hour, 4-hour, or daily XRP/USDT analysis?#ChainlinkLaunchesCCIP2WithEnterpriseVerification #QNTFallsOver40%FromMorningHigh #KospiFalls2.7%SamsungSKHynixDropOver5% #BitgetDetailsSecurityIncidentTimeline