$MARSCOIN
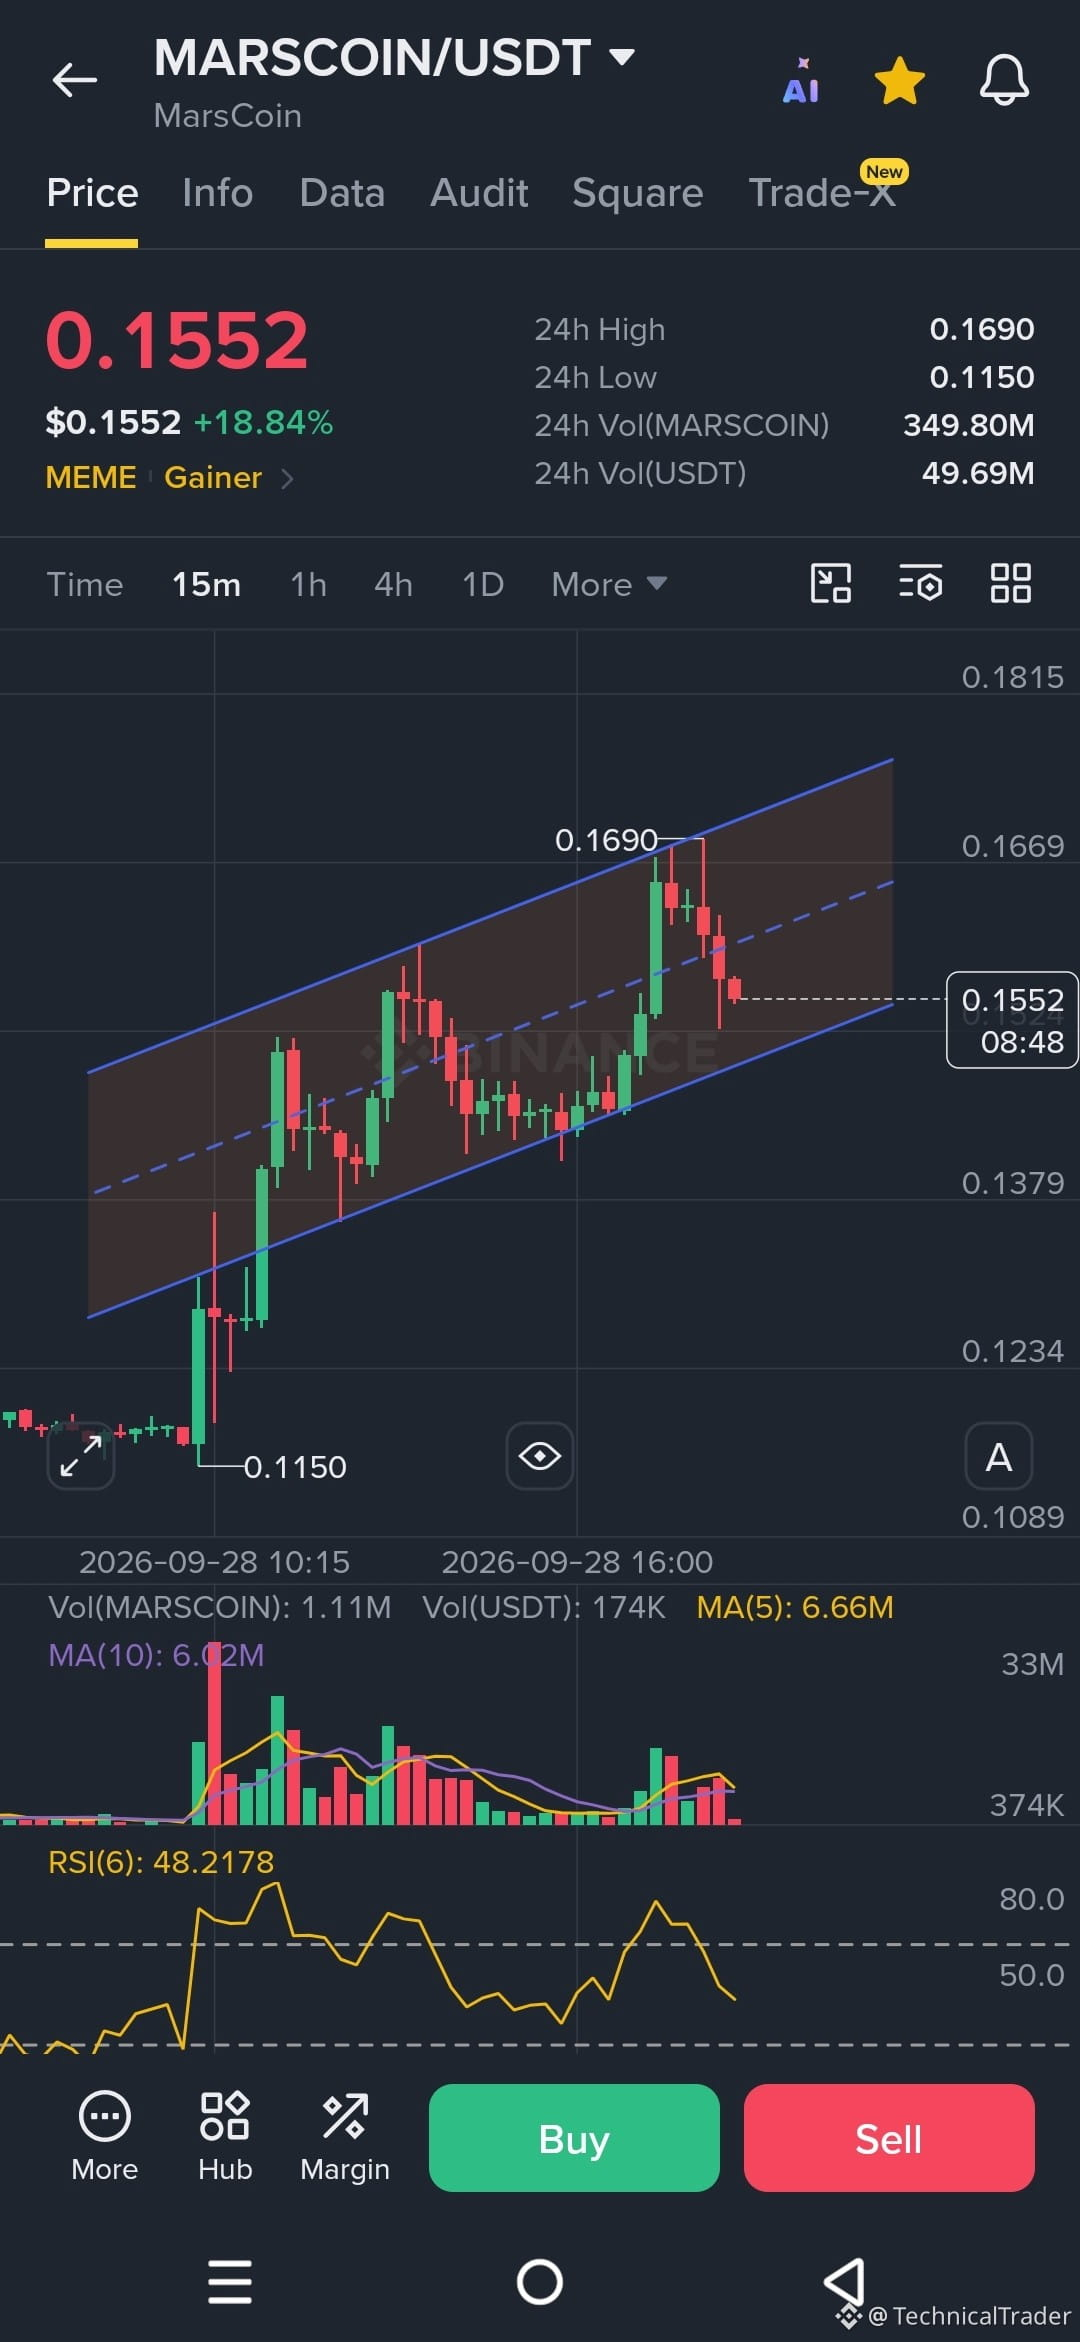
On the 15m chart, price is moving inside a clear ascending channel, with higher highs and higher lows visible through the move.
We recently pushed up to 0.1690 and then saw a rejection, bringing price back to 0.1552. Take a look at this reaction because price is now testing the lower portion of the channel. 📉
The 0.1690 area is the main visible resistance, while the lower channel boundary is the important support to watch right now. If price holds this area and starts making higher lows again, a move back toward the middle and upper part of the channel becomes possible.
On the other hand, a decisive 15m close below the lower channel boundary would weaken the current structure and could open the way toward the lower visible levels around 0.1379. 👀
RSI is around 48, showing that momentum has cooled significantly from the earlier stronger reading, while volume also increased during the recent push and then started fading on the pullback.
Watch how price reacts at the lower channel support. A strong bounce would keep the ascending structure intact, while a clear breakdown and failure to reclaim that boundary would invalidate this channel-based setup. 🎯
Guys follow for more chart analysis 😎 I’ll keep showing you exactly what the chart is telling us. 👀🔥
On the 15m chart, price is moving inside a clear ascending channel, with higher highs and higher lows visible through the move.
We recently pushed up to 0.1690 and then saw a rejection, bringing price back to 0.1552. Take a look at this reaction because price is now testing the lower portion of the channel. 📉
The 0.1690 area is the main visible resistance, while the lower channel boundary is the important support to watch right now. If price holds this area and starts making higher lows again, a move back toward the middle and upper part of the channel becomes possible.
On the other hand, a decisive 15m close below the lower channel boundary would weaken the current structure and could open the way toward the lower visible levels around 0.1379. 👀
RSI is around 48, showing that momentum has cooled significantly from the earlier stronger reading, while volume also increased during the recent push and then started fading on the pullback.
Watch how price reacts at the lower channel support. A strong bounce would keep the ascending structure intact, while a clear breakdown and failure to reclaim that boundary would invalidate this channel-based setup. 🎯
Guys follow for more chart analysis 😎 I’ll keep showing you exactly what the chart is telling us. 👀🔥