
$BITCOIN WEEKLY ANALYSIS
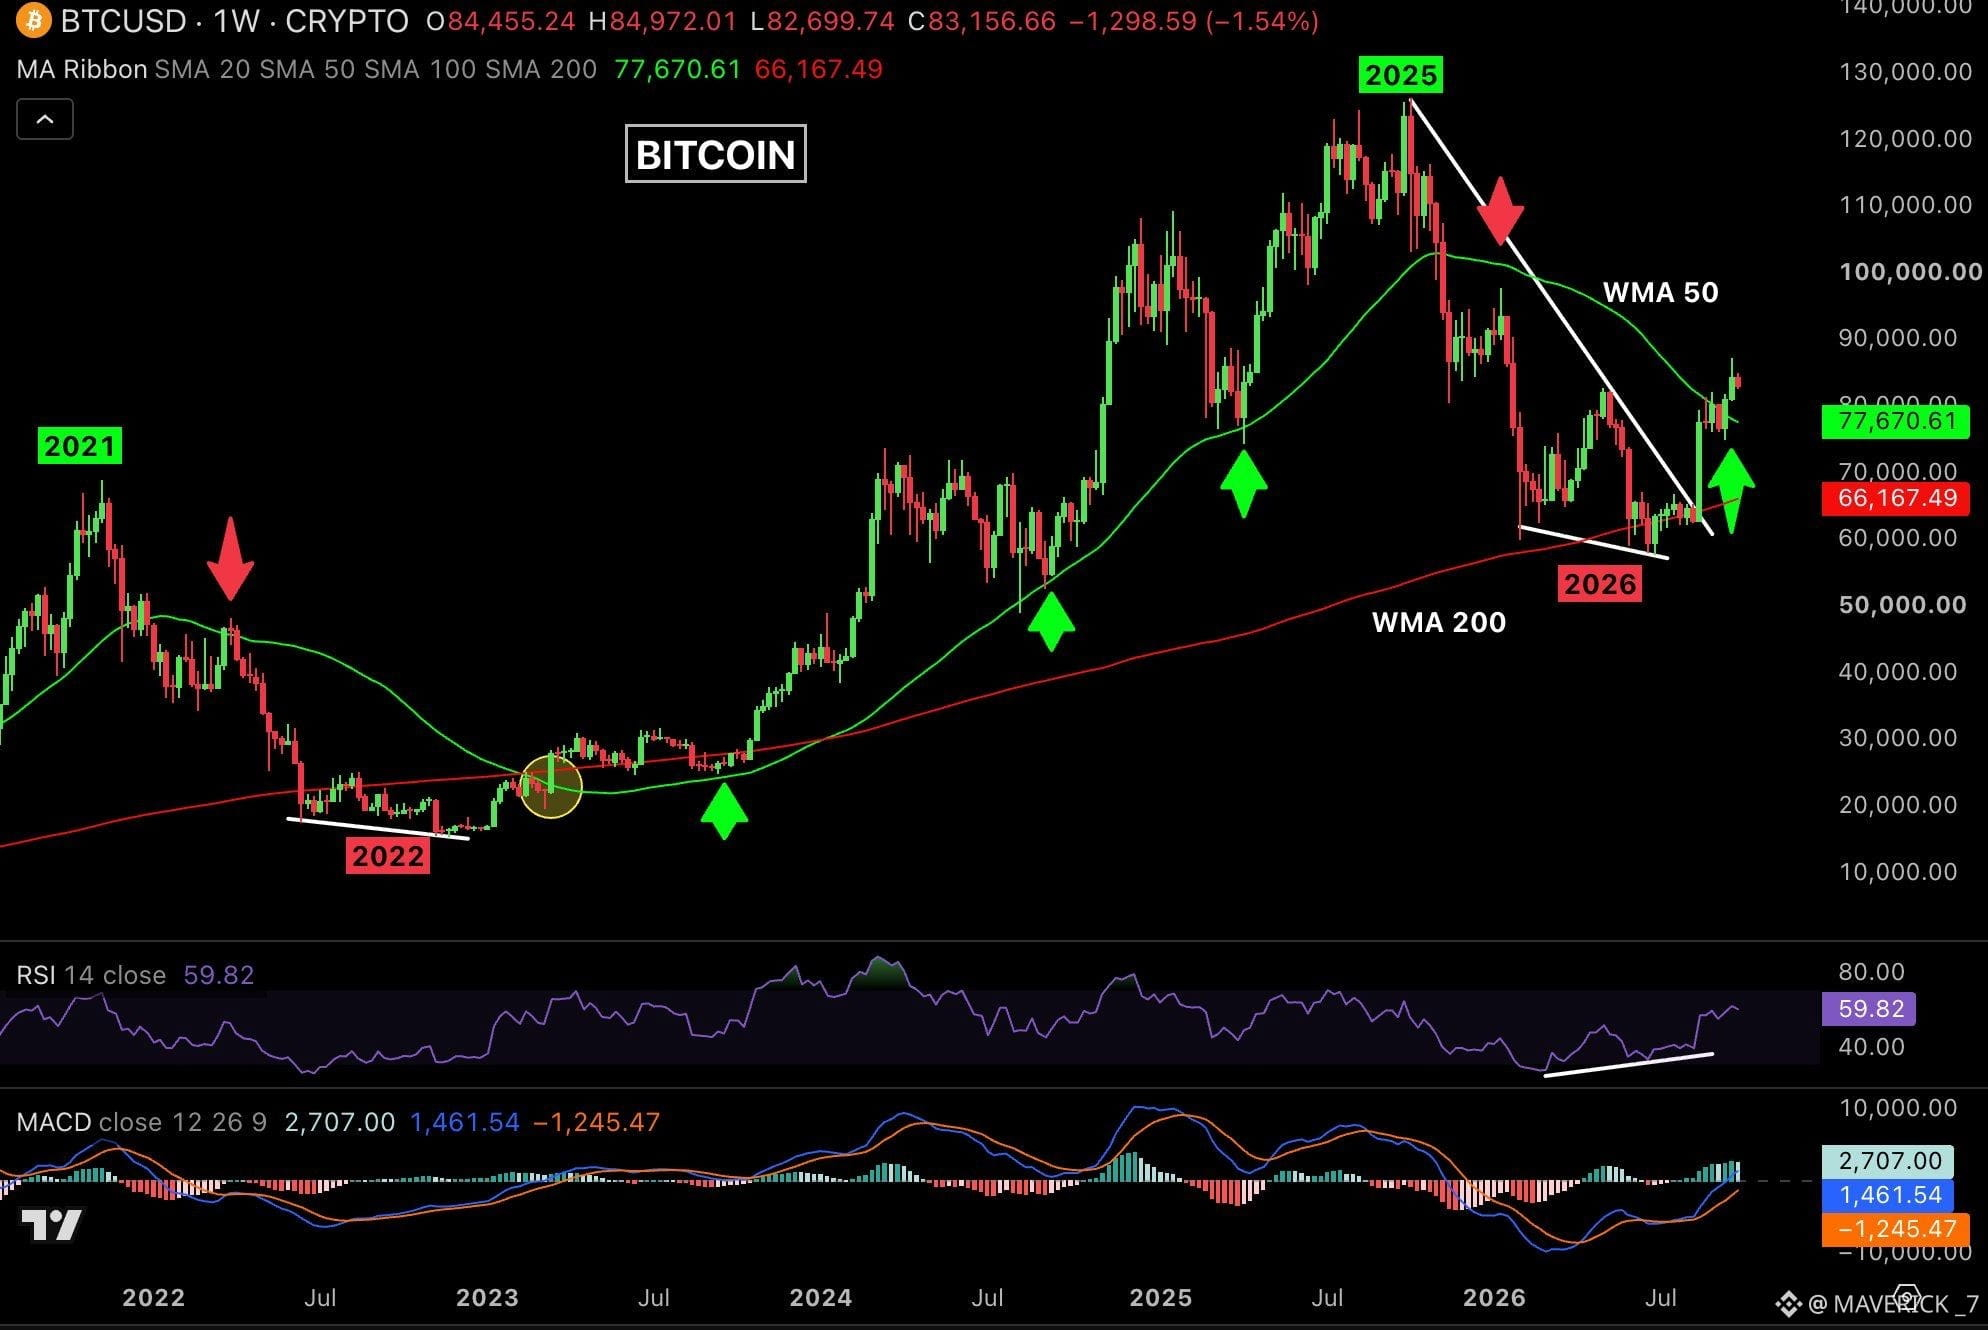
Bitcoin pumped 4% last week and closed at $84,445, its highest weekly close in 8 months and second consecutive close above the Weekly MA 50.
So how did Bitcoin go from $57K to $87K?
BTC spent 11 weeks testing the Weekly MA 200 and it held as support. During that time, MACD turned bullish, RSI showed a bullish divergence and momentum started shifting toward bulls.
Then BTC broke above $67K and spent the next 4 weeks testing the Weekly MA 50, while $75K held as support.
Once Bitcoin finally closed above the Weekly MA 50, another short squeeze pushed BTC above $86K.
Meanwhile, the macro data was also improving:
- ISM hit 55.6, a 4 year high.
- Russell 2000 broke to a new ATH.
- Core inflation cooled toward a 5 year low.
Important levels:
- Support: Weekly MA 50 at $77,670 | Daily MA 200 at $71,100
- Resistance: $87K to $98K
Important events this week:
- ISM: Thursday
- Jobs data: Friday
$BTC
Bitcoin pumped 4% last week and closed at $84,445, its highest weekly close in 8 months and second consecutive close above the Weekly MA 50.
So how did Bitcoin go from $57K to $87K?
BTC spent 11 weeks testing the Weekly MA 200 and it held as support. During that time, MACD turned bullish, RSI showed a bullish divergence and momentum started shifting toward bulls.
Then BTC broke above $67K and spent the next 4 weeks testing the Weekly MA 50, while $75K held as support.
Once Bitcoin finally closed above the Weekly MA 50, another short squeeze pushed BTC above $86K.
Meanwhile, the macro data was also improving:
- ISM hit 55.6, a 4 year high.
- Russell 2000 broke to a new ATH.
- Core inflation cooled toward a 5 year low.
Important levels:
- Support: Weekly MA 50 at $77,670 | Daily MA 200 at $71,100
- Resistance: $87K to $98K
Important events this week:
- ISM: Thursday
- Jobs data: Friday
$BTC