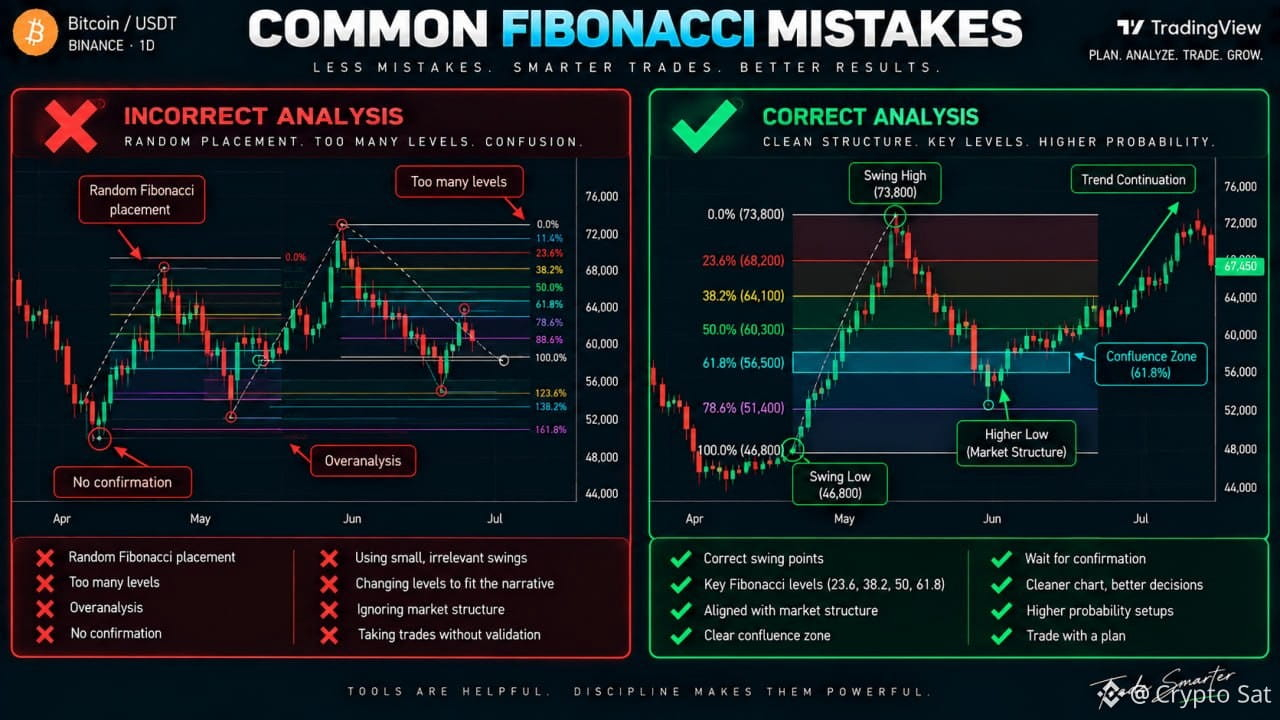
Common Fibonacci Mistakes
Fibonacci can be a useful tool for finding potential pullback zones.
But many beginners make the same mistakes — and end up forcing the chart to fit the tool.
Let's break them down.
1️⃣ Drawing From Random Points
Don't place Fibonacci on random highs and lows just because the levels look attractive.
Use clear, meaningful swing points created by a significant price move.
2️⃣ Using Too Many Levels
Your chart doesn't need Fibonacci levels everywhere.
Too many lines create confusion and make it harder to identify the levels that actually matter.
Keep your analysis clean and simple.
3️⃣ Treating Every Level as a Reversal
Price touching 38.2%, 50%, or 61.8% doesn't mean it's going to reverse.
These are potential reaction zones, not guaranteed turning points.
4️⃣ Ignoring Market Structure
Fibonacci should never replace structure.
Always check:
• HH + HL in an uptrend
• LH + LL in a downtrend
Structure tells you the bigger story.
5️⃣ Ignoring Higher Timeframes
A Fibonacci level on the 5M chart may be insignificant compared with a major level on the 4H or Daily chart.
Always understand the higher-timeframe context first.
6️⃣ Entering Without Confirmation
Price touching Fibonacci is not an entry signal.
Wait for rejection, volume, structure shifts, breakouts, or retests.
7️⃣ Using Fibonacci Alone
This is the biggest mistake.
Fibonacci works better when combined with support/resistance, market structure, trendlines, volume, and price action.
Remember: Fibonacci is a tool — not a complete trading strategy. 🎯
Are you using Fibonacci to analyze the market, or forcing the market to fit your Fibonacci?
Learn the tool. Understand the structure. Wait for confirmation. 🚀
Fibonacci can be a useful tool for finding potential pullback zones.
But many beginners make the same mistakes — and end up forcing the chart to fit the tool.
Let's break them down.
1️⃣ Drawing From Random Points
Don't place Fibonacci on random highs and lows just because the levels look attractive.
Use clear, meaningful swing points created by a significant price move.
2️⃣ Using Too Many Levels
Your chart doesn't need Fibonacci levels everywhere.
Too many lines create confusion and make it harder to identify the levels that actually matter.
Keep your analysis clean and simple.
3️⃣ Treating Every Level as a Reversal
Price touching 38.2%, 50%, or 61.8% doesn't mean it's going to reverse.
These are potential reaction zones, not guaranteed turning points.
4️⃣ Ignoring Market Structure
Fibonacci should never replace structure.
Always check:
• HH + HL in an uptrend
• LH + LL in a downtrend
Structure tells you the bigger story.
5️⃣ Ignoring Higher Timeframes
A Fibonacci level on the 5M chart may be insignificant compared with a major level on the 4H or Daily chart.
Always understand the higher-timeframe context first.
6️⃣ Entering Without Confirmation
Price touching Fibonacci is not an entry signal.
Wait for rejection, volume, structure shifts, breakouts, or retests.
7️⃣ Using Fibonacci Alone
This is the biggest mistake.
Fibonacci works better when combined with support/resistance, market structure, trendlines, volume, and price action.
Remember: Fibonacci is a tool — not a complete trading strategy. 🎯
Are you using Fibonacci to analyze the market, or forcing the market to fit your Fibonacci?
Learn the tool. Understand the structure. Wait for confirmation. 🚀