VELVET is extending below its daily stack.
📓 Trade note | VELVET
$VELVET /USDT · Bias: SHORT · 6/12 signals aligned
Technical verdict: STRONG SHORT. 6 of 12 signals aligned, 1 against.
What supports it (6):
• Daily trend: price < EMA50 < EMA200, bearish stack
• 4h trend: price < EMA50 < EMA200, bearish stack
• Trend strength (ADX/DI, 15m): ADX 60.0 with sellers in control (DI+ 9.4 vs DI− 31.0)
• 4h RSI: 34.2, bearish momentum (below 45)
What argues against (1):
• Distance from 1h EMA50: −3.4 ATR from the 1h EMA50, overextended with bounce risk
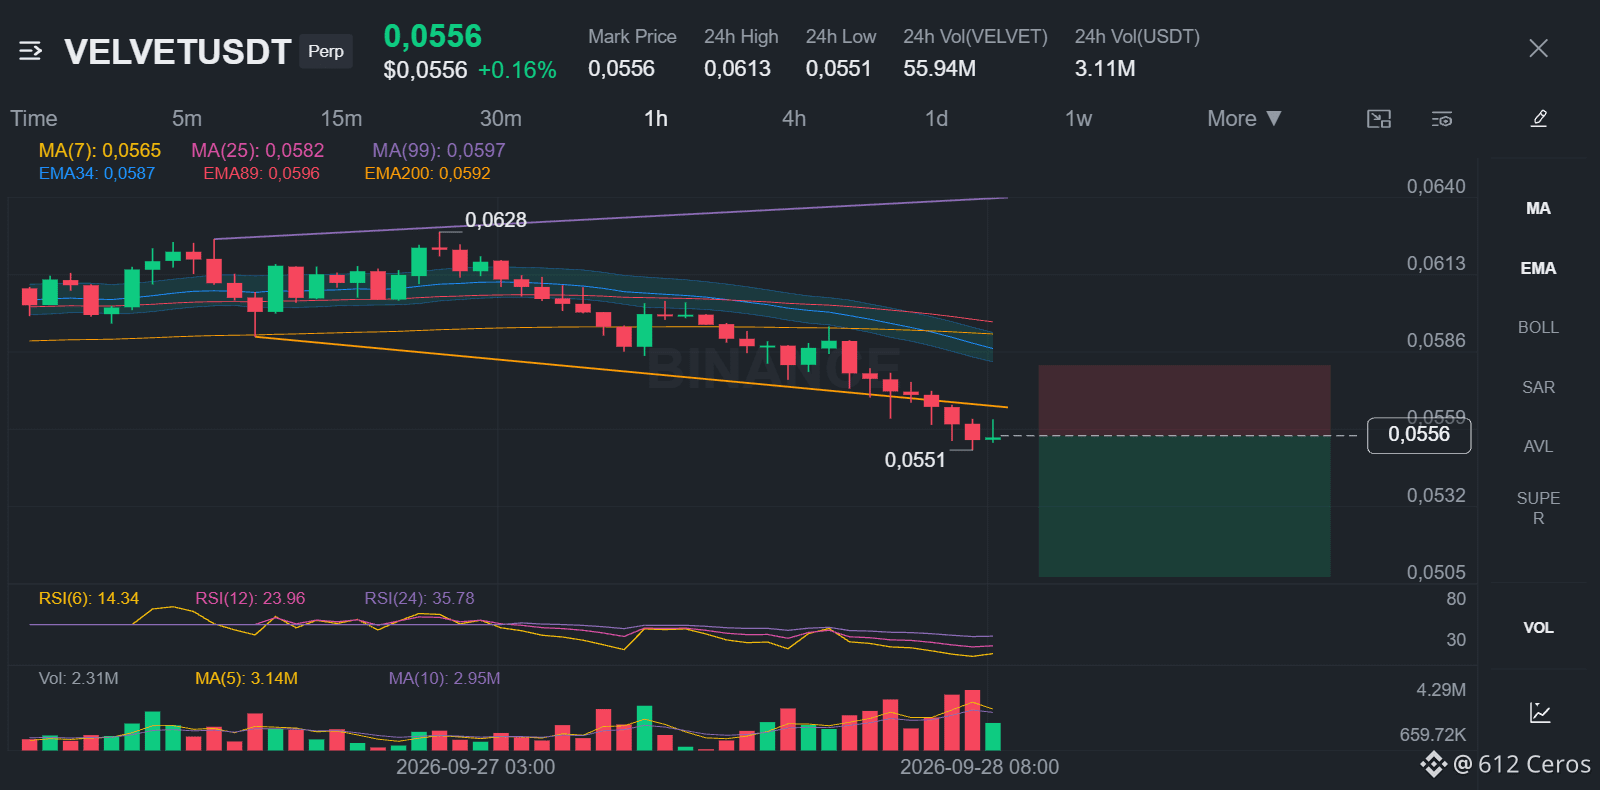
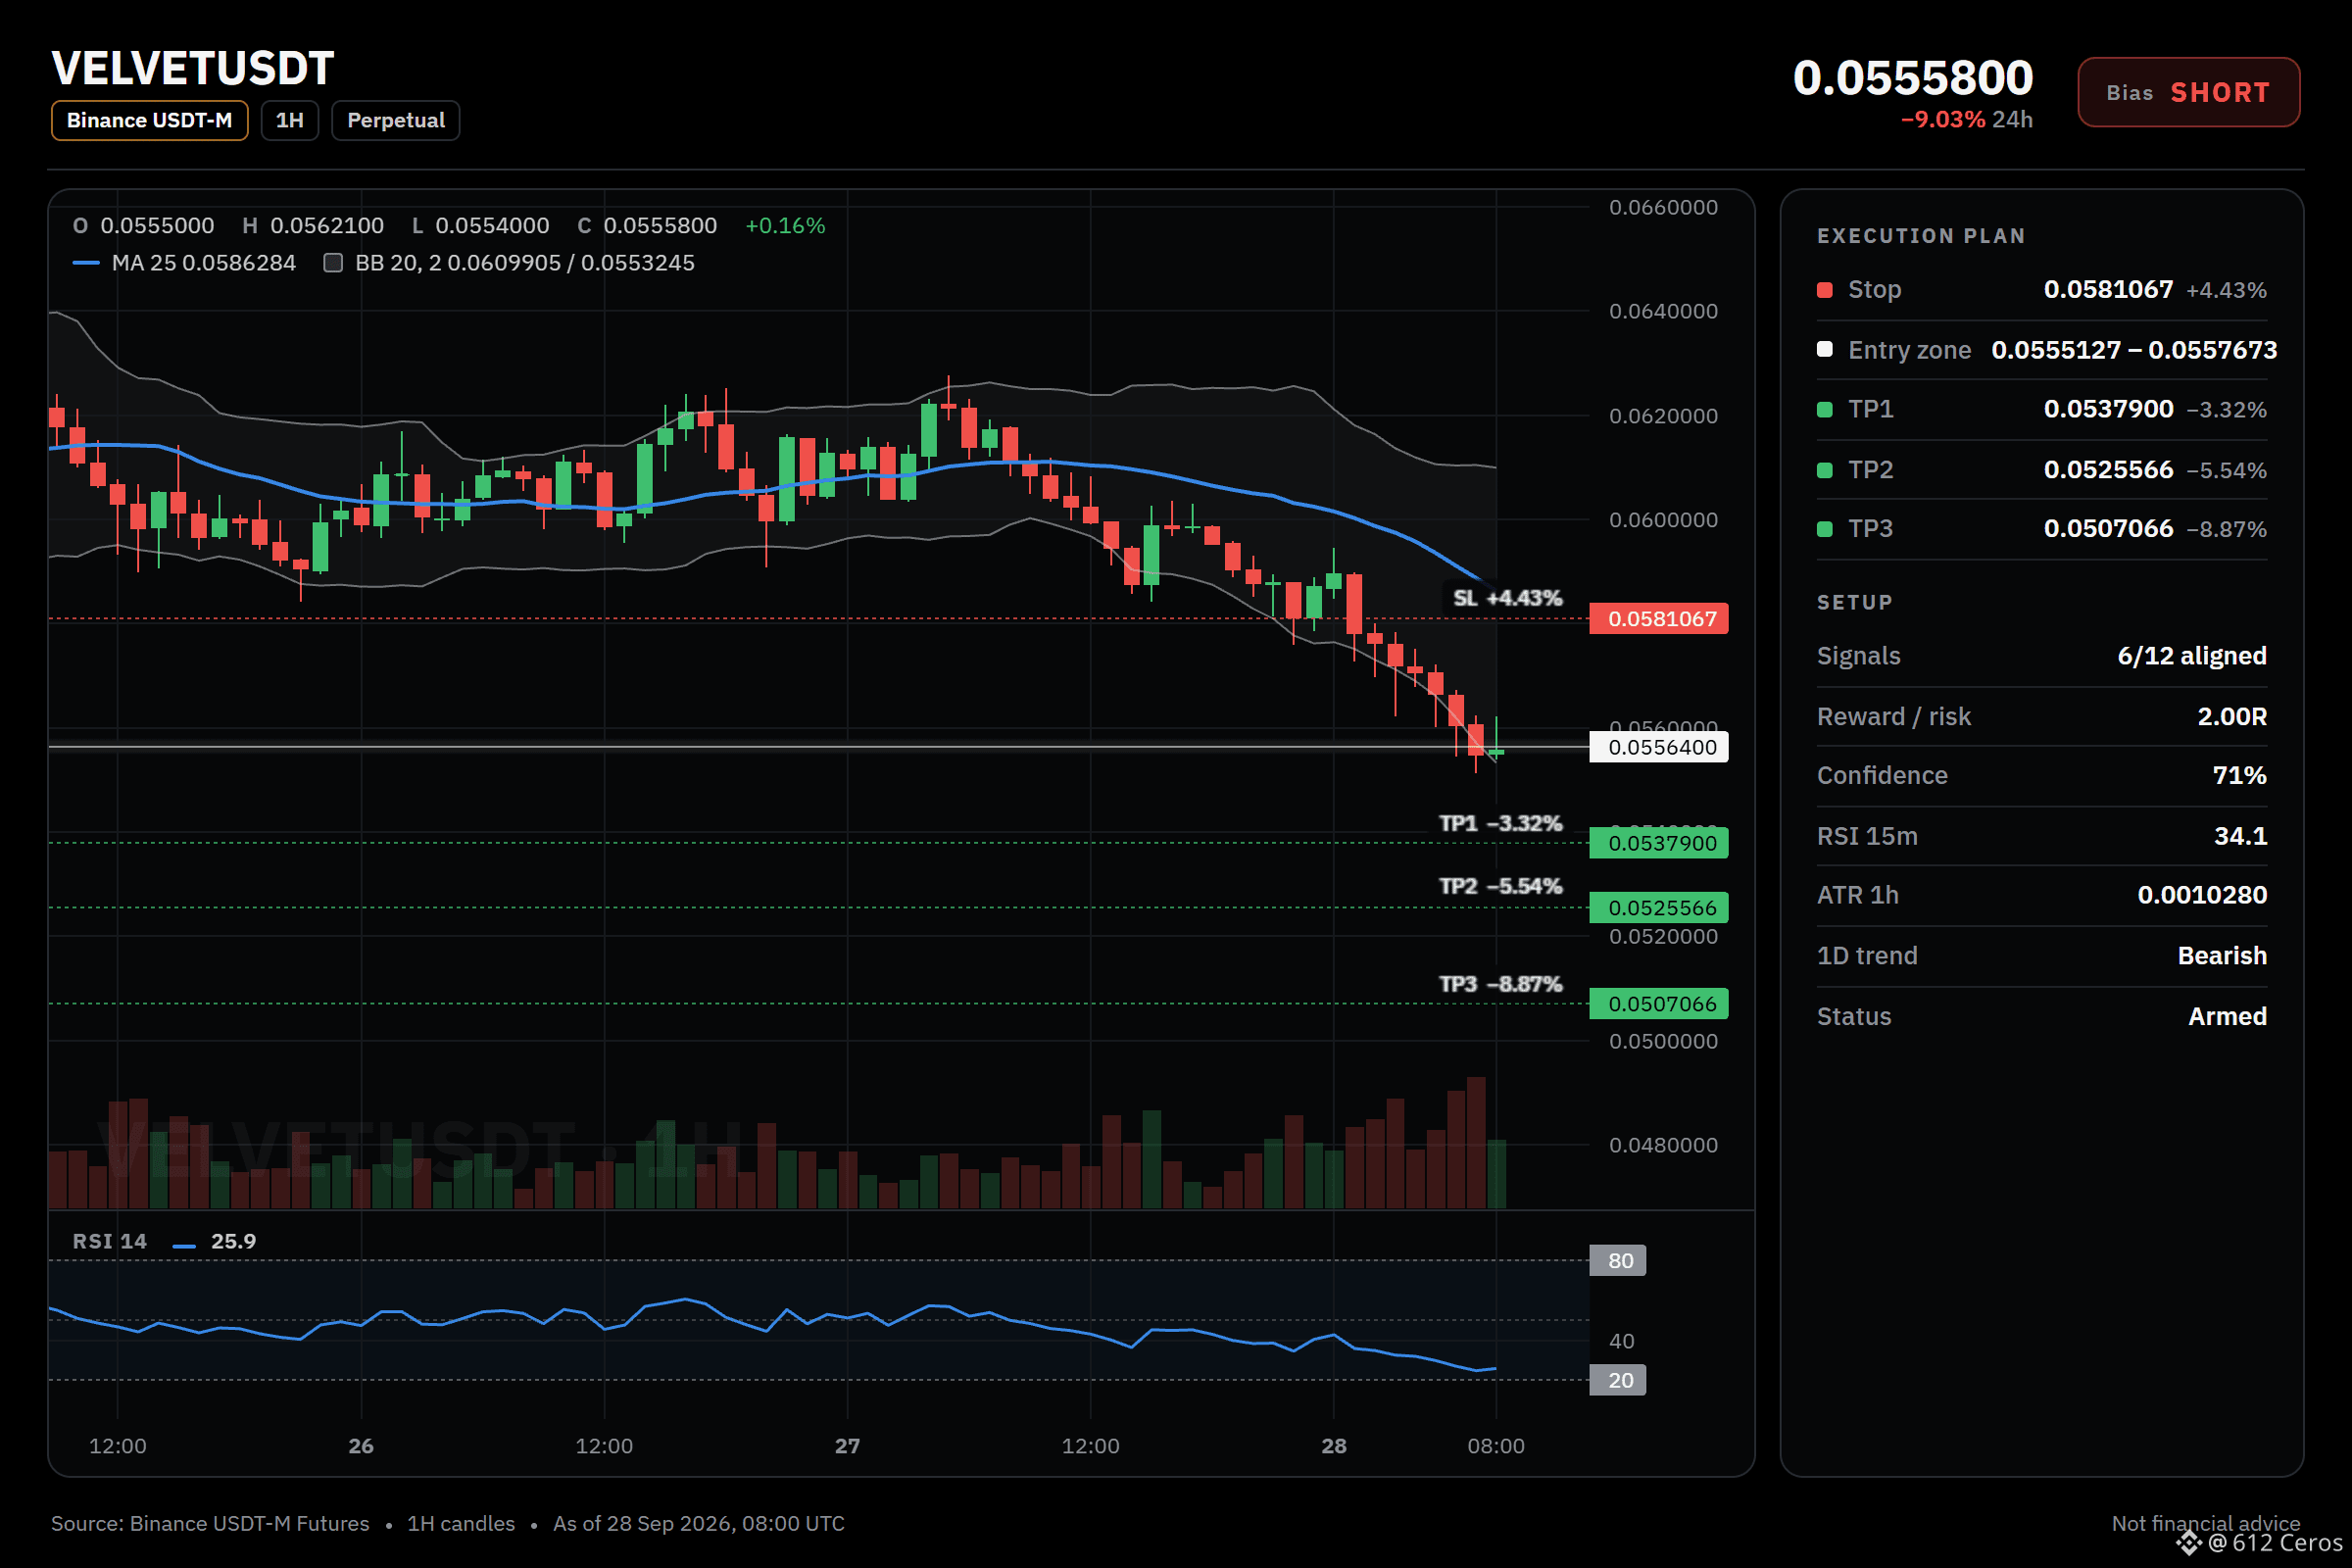
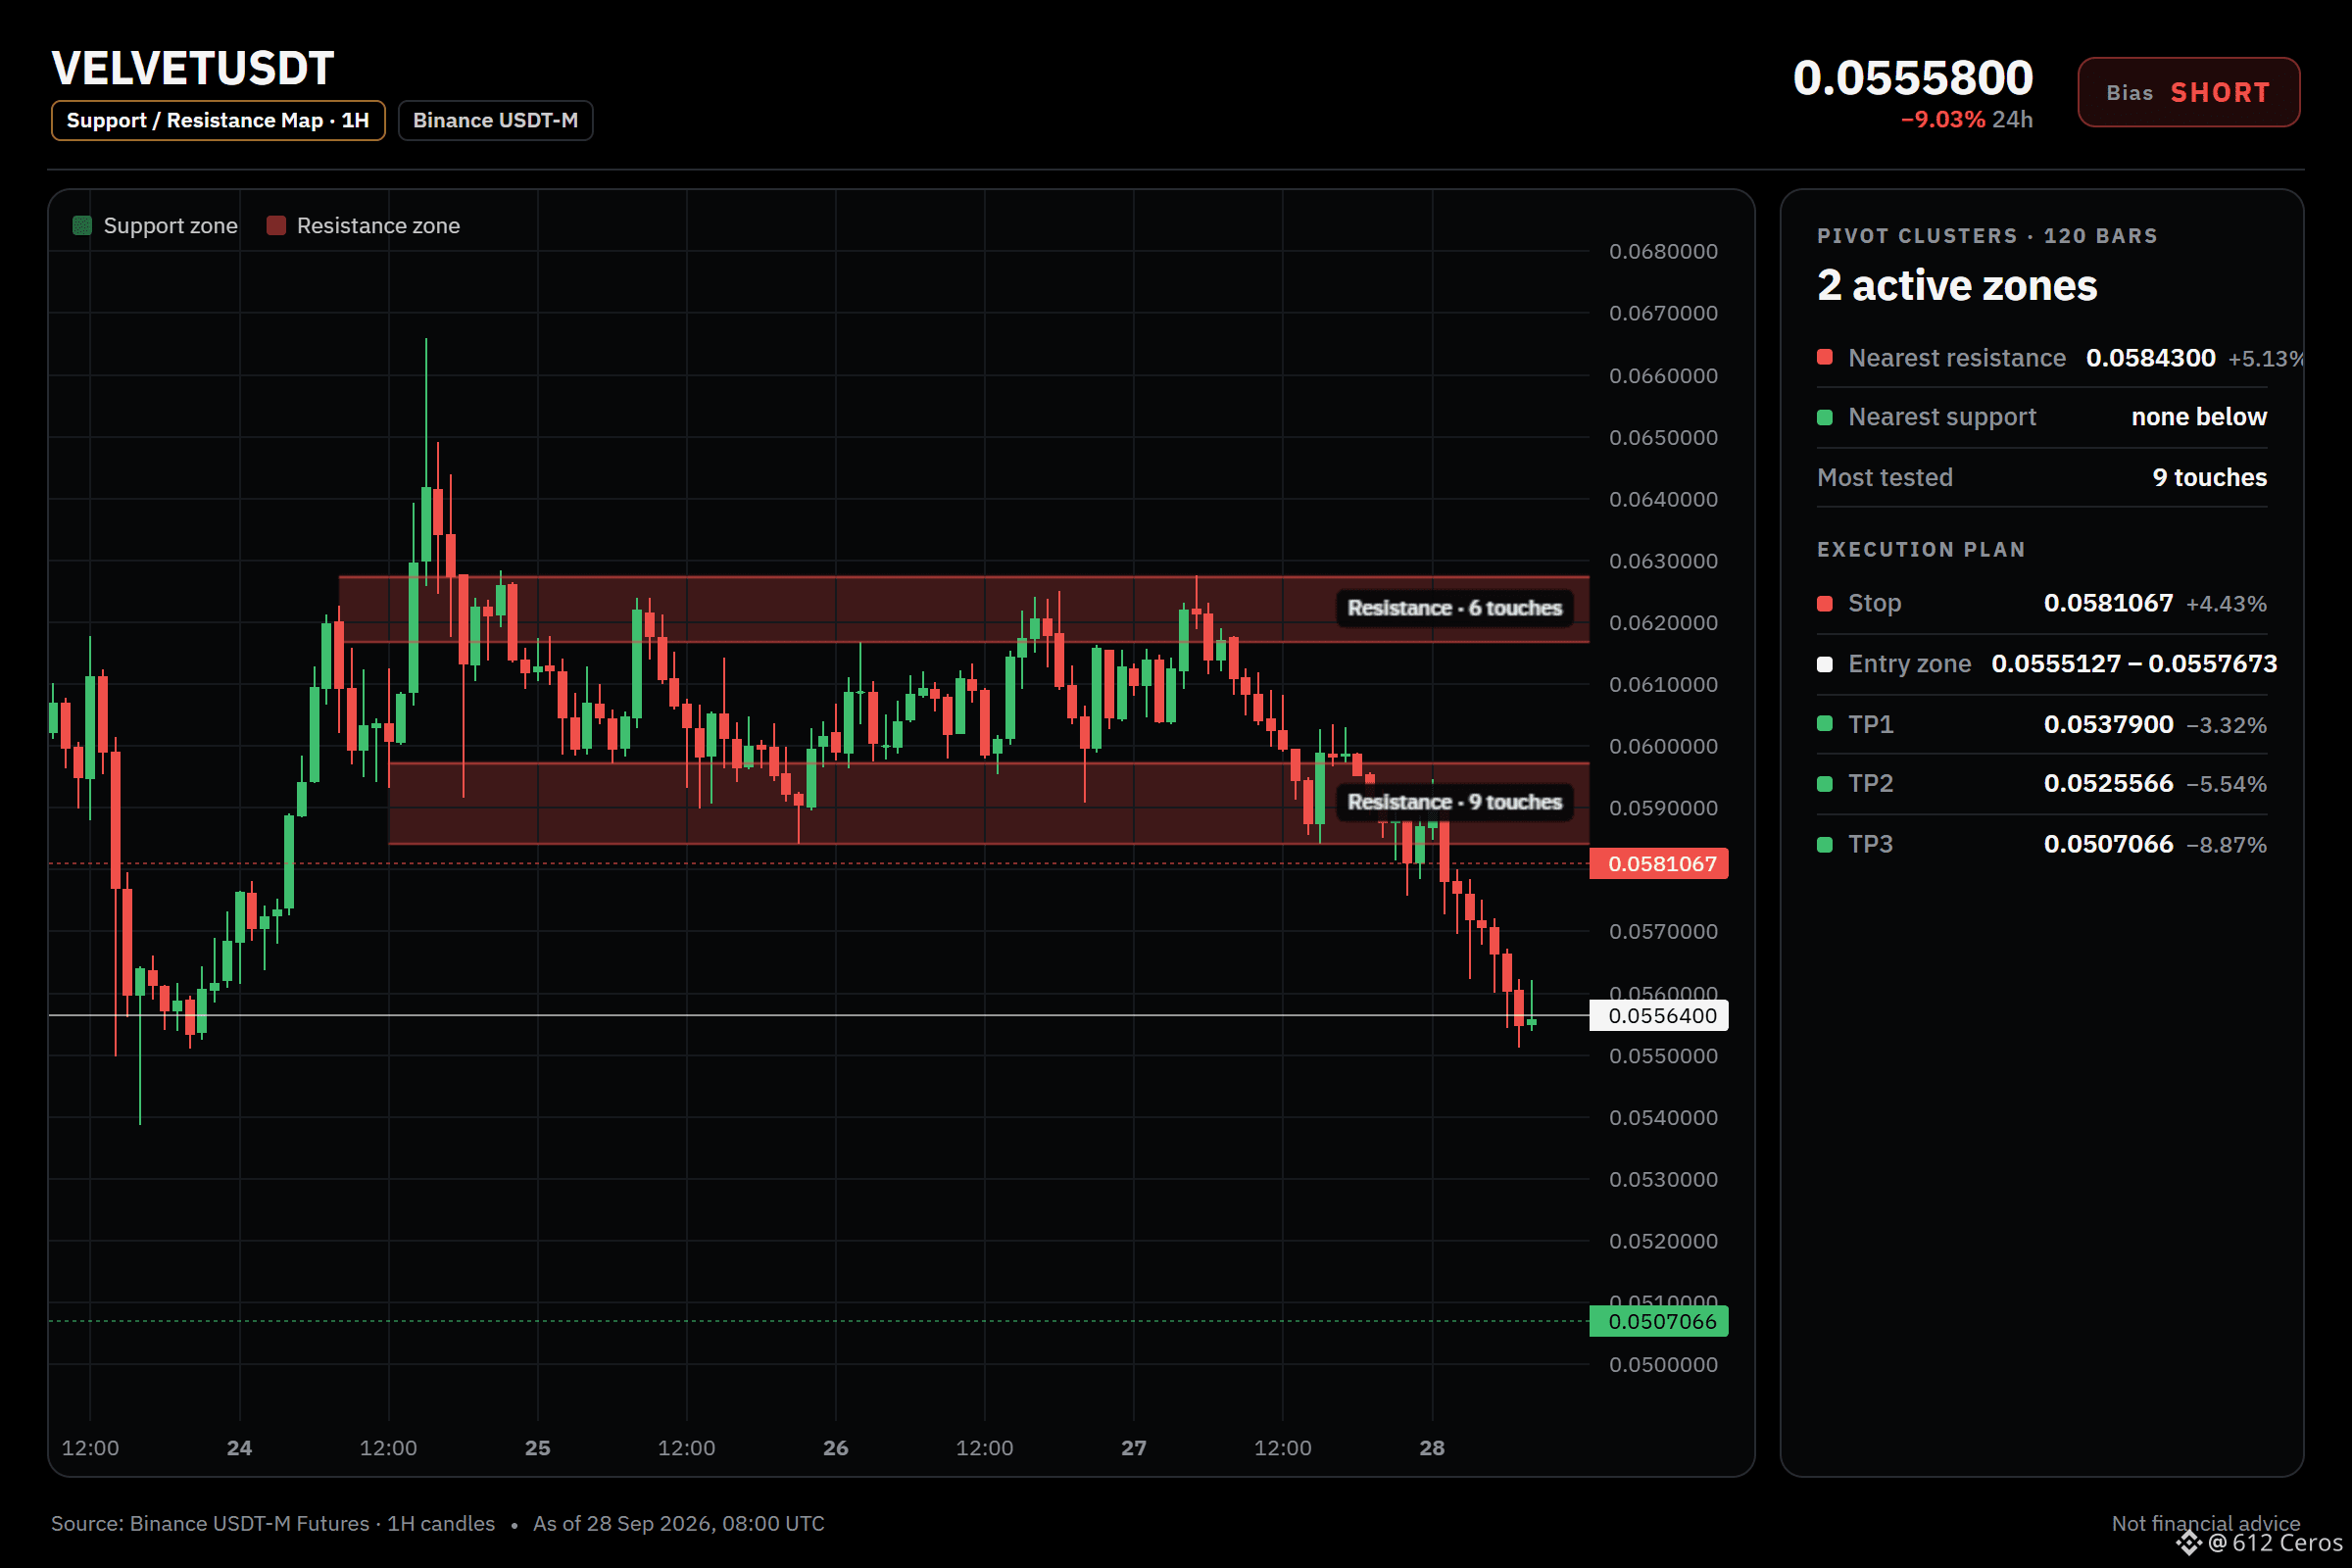
I'm watching VELVET for a short entry near 0.0556400 on the 1h chart. I want to see price hold below the 1h EMA50 with the daily trend remaining bearish and the 4h EMA stack intact. The setup is strong with ADX at 60.0 and the 1h RSI near 26, but the price is sitting 3.4 ATR below the 1h EMA50, which is a lot of stretch. I would be wrong if price pushes back above 0.0609340, so I am keeping that as my hard invalidation.
Entry: 0.0555127 – 0.0557673 | SL: 0.0581067
TP1: 0.0537900 | TP2: 0.0525566 | TP3: 0.0507066
Where would you place your invalidation if you were fading this bounce instead?
Chart with every level 👇
📲 Want more of my latest signals? Join me here:
https://app.binance.com/uni-qr/D26WbL9t
⚠️ Personal market analysis only. NFA — manage risk and DYOR.
Educational content, not investment advice or a recommendation to buy, sell, deposit, or withdraw any asset. No paid promotion or referral/affiliate links.
📓 Trade note | VELVET
$VELVET /USDT · Bias: SHORT · 6/12 signals aligned
Technical verdict: STRONG SHORT. 6 of 12 signals aligned, 1 against.
What supports it (6):
• Daily trend: price < EMA50 < EMA200, bearish stack
• 4h trend: price < EMA50 < EMA200, bearish stack
• Trend strength (ADX/DI, 15m): ADX 60.0 with sellers in control (DI+ 9.4 vs DI− 31.0)
• 4h RSI: 34.2, bearish momentum (below 45)
What argues against (1):
• Distance from 1h EMA50: −3.4 ATR from the 1h EMA50, overextended with bounce risk
I'm watching VELVET for a short entry near 0.0556400 on the 1h chart. I want to see price hold below the 1h EMA50 with the daily trend remaining bearish and the 4h EMA stack intact. The setup is strong with ADX at 60.0 and the 1h RSI near 26, but the price is sitting 3.4 ATR below the 1h EMA50, which is a lot of stretch. I would be wrong if price pushes back above 0.0609340, so I am keeping that as my hard invalidation.
Entry: 0.0555127 – 0.0557673 | SL: 0.0581067
TP1: 0.0537900 | TP2: 0.0525566 | TP3: 0.0507066
Where would you place your invalidation if you were fading this bounce instead?
Chart with every level 👇
📲 Want more of my latest signals? Join me here:
https://app.binance.com/uni-qr/D26WbL9t
⚠️ Personal market analysis only. NFA — manage risk and DYOR.
Educational content, not investment advice or a recommendation to buy, sell, deposit, or withdraw any asset. No paid promotion or referral/affiliate links.