



Bitcoin is sitting on the exact level Jurrien Timmer has been watching.
As of September 28, BTC is hovering around $84,000 on Binance — roughly 19% below $100,000. That is not a random round number. Fidelity’s global macro director tied a clean break and hold above $80,000 to a double-bottom measured move toward six figures. Price has already tagged that zone, spiked toward $87,500, and is now digesting the move instead of giving it all back.
That is the setup. Whether it sticks is the trade.
The $80,000 trigger Timmer flagged
Timmer runs global macro strategy at Fidelity Investments. In late September he posted a weekly chart and said, in so many words: Bitcoin looks interesting here because it is challenging key resistance at $80,000. If it breaks, that confirms a double bottom targeting $100,000.
The two troughs on his chart are this year’s lows: $60,033 in February and $57,742 in late June. The neckline sits near $80,554, with earlier supply around $82,800–$82,300. Classic pattern math from the late-June low up to that neckline points closer to $103,000. Timmer is using $100,000 as the clean first target.
This is a real shift in tone from the same analyst. In December 2025 he floated the idea that 2026 could be “a year off,” with support in the $65,000–$75,000 band. That floor did not hold. Price went lower. Then it defended $60,000 — the level he calls the power-law “line in the sand” — and started working the $80,000 ceiling.
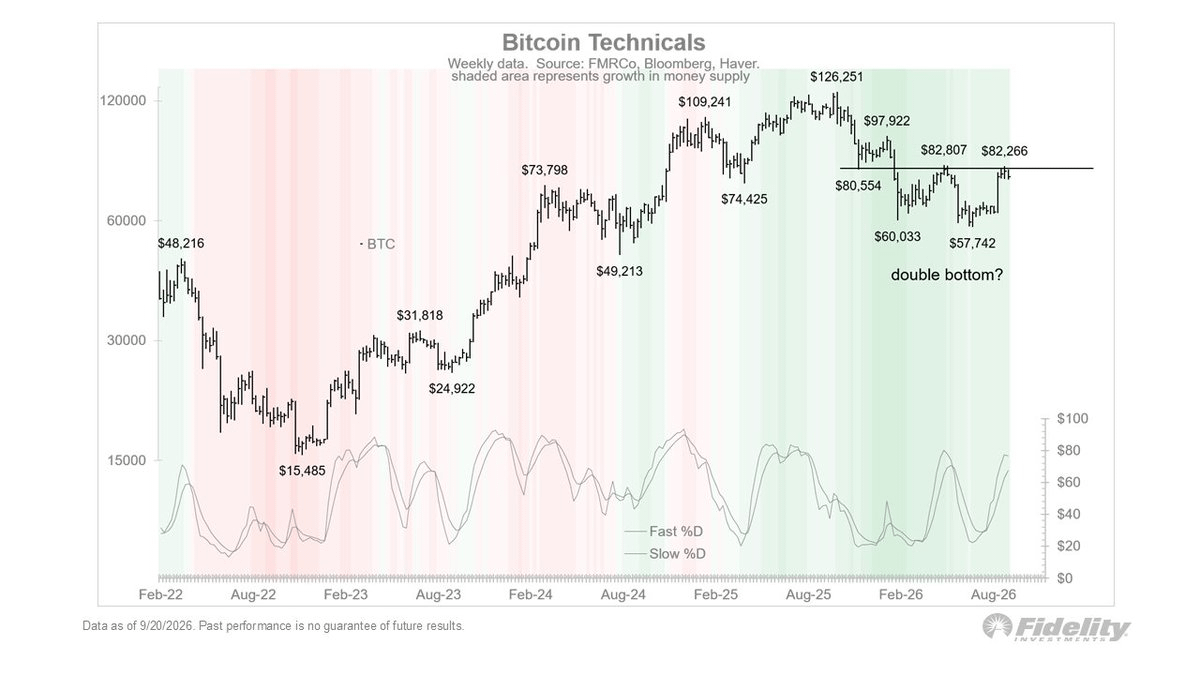
Note : Fidelity weekly chart (data through Sep 20). Two lows at $60,033 and $57,742, neckline near $80,554. Timmer’s read: a confirmed break opens $100,000. Source: Fidelity / Jurrien Timmer.
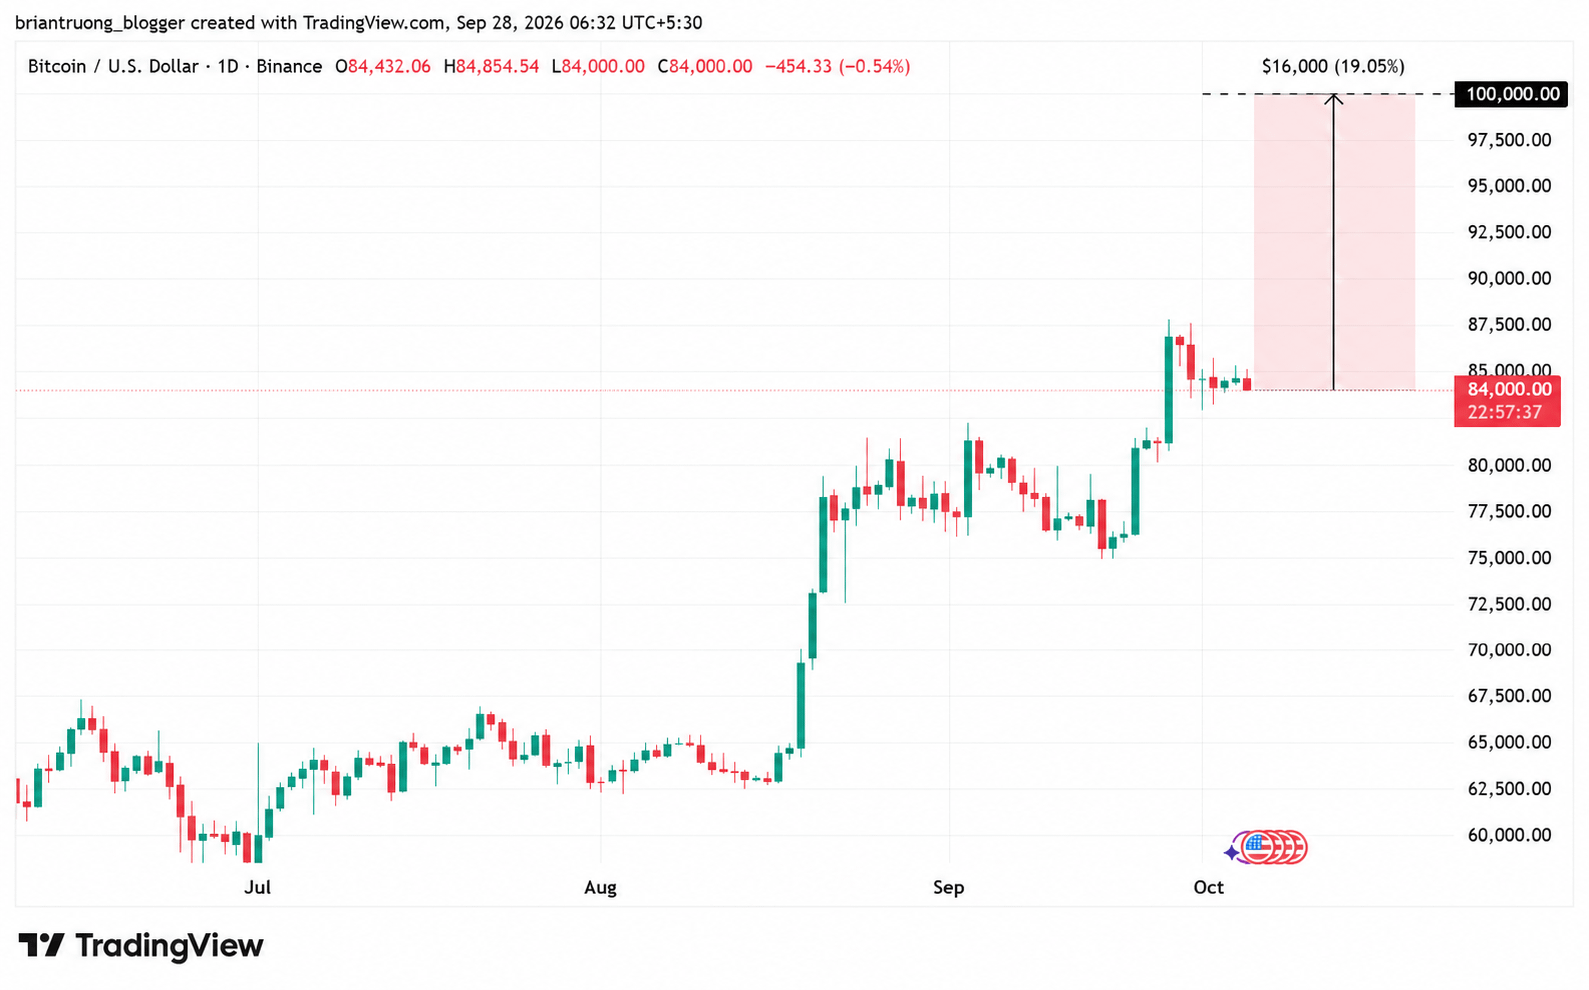
Note: BTC/USD daily, Binance, Sep 28. Price around $84,000 with a measured push of about $16,000 (19%) to $100,000. The pink box is the gap Timmer is talking about — not a promise, just the distance.
Why Fidelity still talks about $300,000 in 2029
The $100,000 call is the near-term technical. The bigger number sits on a different model.
Timmer’s Bitcoin power-law chart treats price as a function of time, with a trendline and a lower support band. $60,000 is marked as the line in the sand. Hold that, and he argues a new cyclical bull is already underway, with the curve pointing toward $300,000 by 2029.
That is not a moon-bag slogan. It is a slower, diminishing-returns path: roughly 3.5x from current levels over three years, not the 20x explosions of earlier cycles. On the same chart, the 52-week z-score of the BTC/gold ratio has flipped back to +6% after tagging about -100% — the same neighborhood where prior cycle lows printed (-120%, -118%, -102%).
Useful context, not a timing tool. Power law does not tell you what next week does. It tells you whether the long-term trajectory is still intact. Right now Timmer says it is.
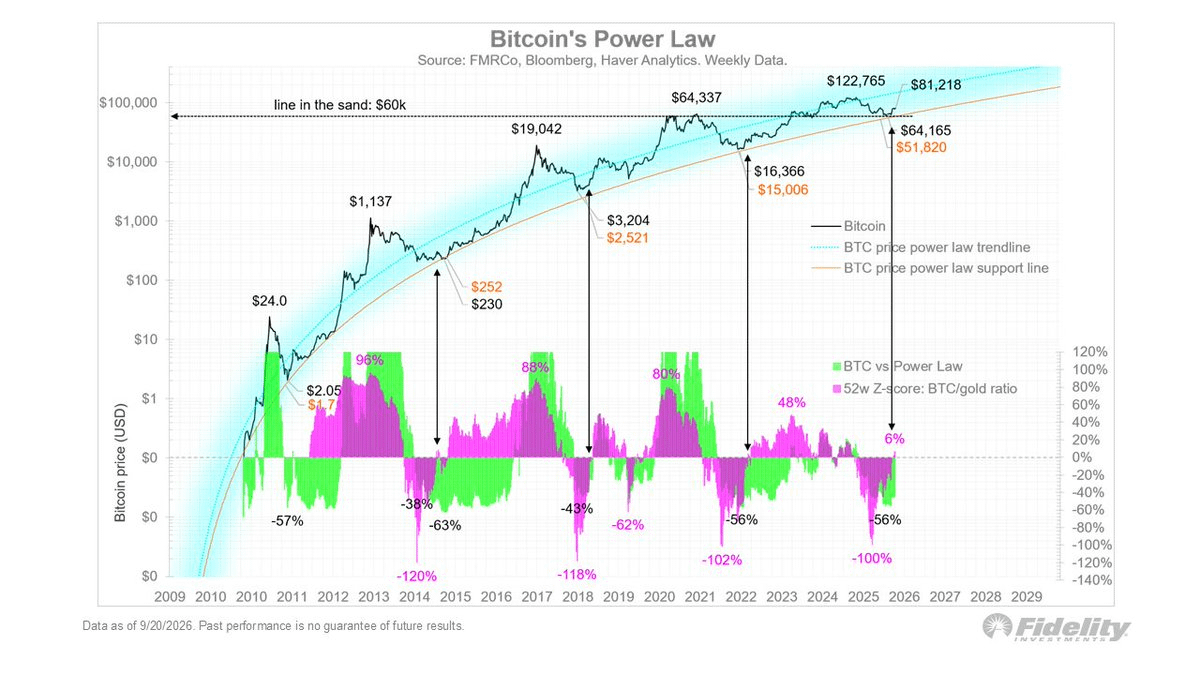
Note: Power-law trend and support, weekly data through Sep 20. $60,000 is the line in the sand. Model path still points toward $300,000 by 2029 if that floor holds. BTC/gold z-score back in positive territory. Source: Fidelity.
Futures specs are not fading the rally
Tom McClellan, who tracks the CFTC Commitments of Traders report every week, has been pointing at the same tape from a different angle.
In Bitcoin futures, “commercials” barely exist the way they do in grain or oil. So the non-commercial book — large specs, think hedge funds — is the closest thing the market has to smart money. Those traders went to a record net-long earlier this year, cut risk when price stalled, then started rebuilding the long side again into the September bounce.
McClellan’s read: the unusual part is they kept adding after price had already jumped, instead of using strength to exit. That is not proof the next candle is green. It is proof the large speculative book is not treating $80,000 as a fade.
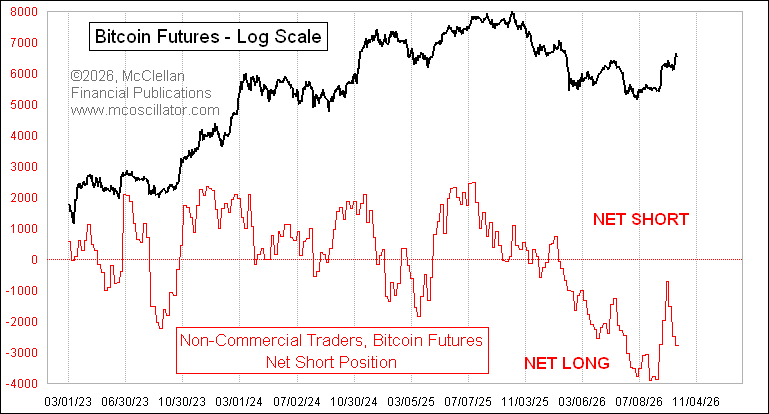
Note : Bitcoin futures, log scale, with non-commercial net position. Deep negative readings on this plot = net long. Specs rebuilt a large long after cutting risk in late summer. Source: Tom McClellan / McClellan Financial Publications.
The part that keeps this honest
Not every signal agrees.
CryptoQuant’s bull-market line — the 365-day moving average — was sitting near $81,700 earlier this month. That average has historically been the “is this actually a new bull market?” filter. Spot is a few thousand dollars above it now. That helps. It does not lock anything in.
The room to be wrong is thin. Lose $80,000 on a weekly close and Timmer’s double-bottom target stops being the base case. Hold it, and $100,000 is the level the chart is built for. Everything between here and there is noise until one of those two things happens.
I am not treating $100,000 as destiny. I am treating $80,000 as the level that decides whether Fidelity’s map is still in play.
By Brian Truong (BeInCrypto)
TRADE $BTC HERE👇
