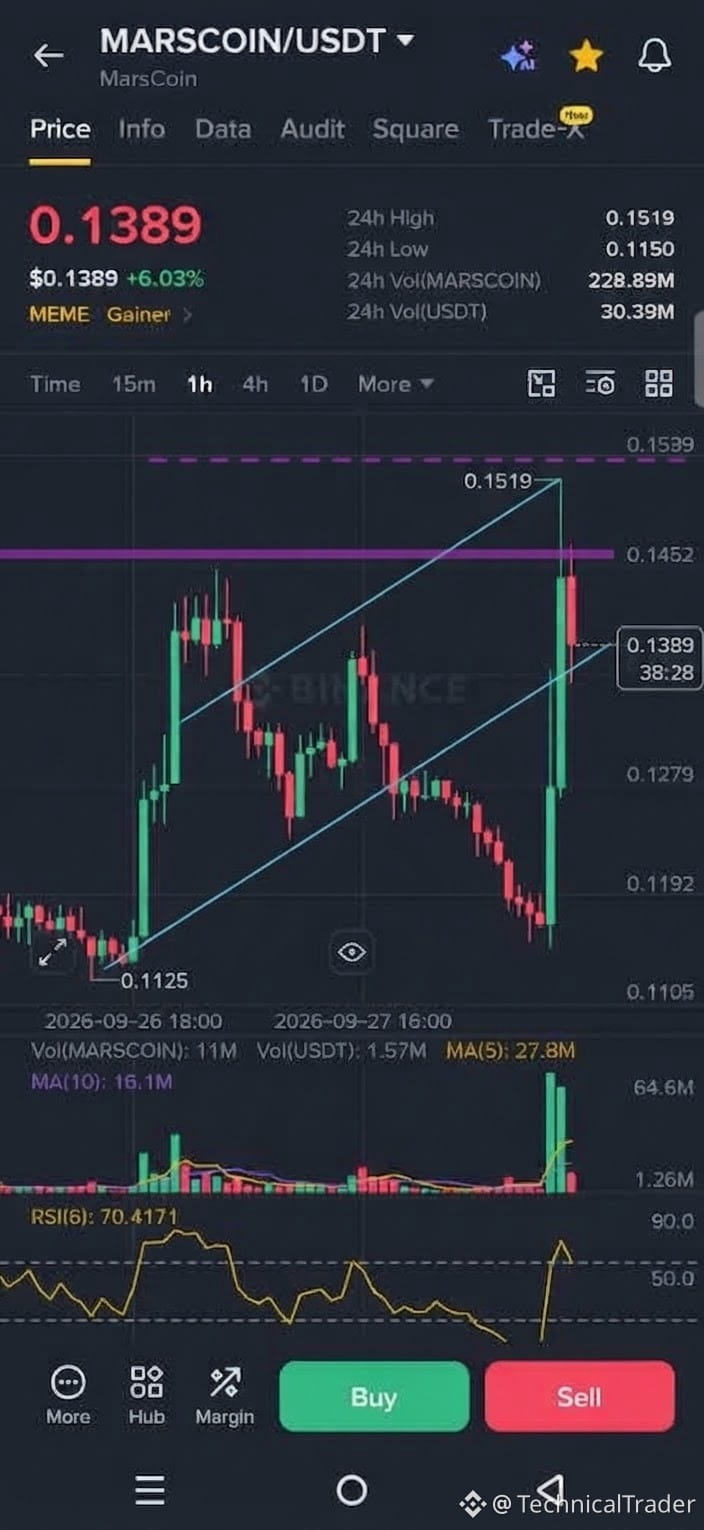
$MARSCOIN price is sitting at 0.1389 after a strong push that tagged 0.1519. You can clearly see the two ascending blue trendlines forming a rising channel from the 0.1125 area.
Price has been respecting that lower line and making higher lows while the upper line has capped the moves so far. Take a look at this level 👀 around 0.1452 where that purple horizontal sits. It acted as resistance earlier and price is now testing the space just below it.
The latest green candle came in with solid volume and pushed RSI(6) up to 70.4, which shows the move had real strength behind it. Notice how price is reacting here after that rejection from 0.1519.
We’re still inside the channel, so the structure remains constructive as long as the lower blue line continues to hold. A clean break and hold above 0.1452 would open the door for another run toward the recent high and the upper purple line near 0.1539.
On the other side, if price loses the lower trendline and slips back under 0.1279 with volume, the short-term strength fades and we could see a deeper pull toward the 0.1192 to 0.1125 zone.
Watch how price reacts here around the mid-channel area. A hold and bounce keeps the bullish structure intact, while a decisive break below the rising support would shift the picture.
Keep an eye on that 0.1452 level and the lower blue trendline next. Those are the two spots that will tell us which side is in control.
Guys follow for more chart analysis 😎 I’ll keep showing you exactly what the chart is telling us. 👀🔥
Price has been respecting that lower line and making higher lows while the upper line has capped the moves so far. Take a look at this level 👀 around 0.1452 where that purple horizontal sits. It acted as resistance earlier and price is now testing the space just below it.
The latest green candle came in with solid volume and pushed RSI(6) up to 70.4, which shows the move had real strength behind it. Notice how price is reacting here after that rejection from 0.1519.
We’re still inside the channel, so the structure remains constructive as long as the lower blue line continues to hold. A clean break and hold above 0.1452 would open the door for another run toward the recent high and the upper purple line near 0.1539.
On the other side, if price loses the lower trendline and slips back under 0.1279 with volume, the short-term strength fades and we could see a deeper pull toward the 0.1192 to 0.1125 zone.
Watch how price reacts here around the mid-channel area. A hold and bounce keeps the bullish structure intact, while a decisive break below the rising support would shift the picture.
Keep an eye on that 0.1452 level and the lower blue trendline next. Those are the two spots that will tell us which side is in control.
Guys follow for more chart analysis 😎 I’ll keep showing you exactly what the chart is telling us. 👀🔥