🚀 $QNT Is Exploding Higher — +125% in 24H! Can Bulls Push Beyond $373? 🔥
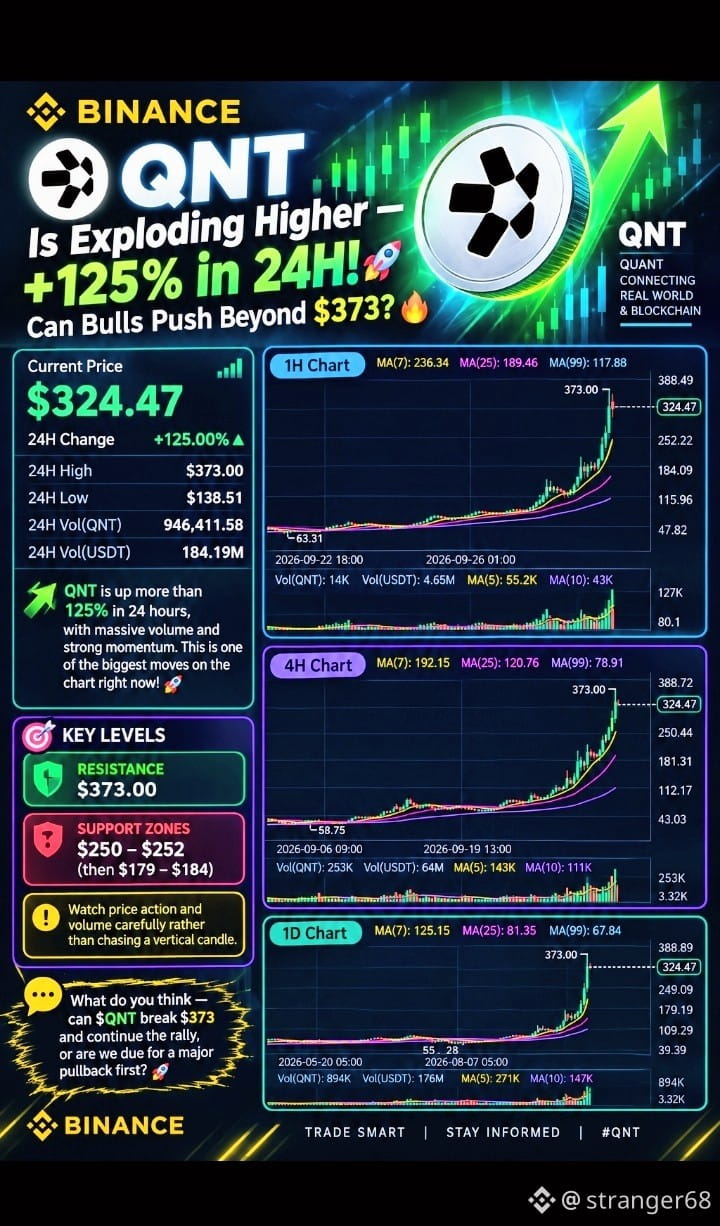
📈 Quant is showing an extraordinary move, trading around $324.47 after reaching a 24H high of $373.00. Volume has surged alongside price, making this one of the biggest momentum moves on the chart right now. ⚡
⏱️ 1H Chart: QNT has accelerated sharply above its moving averages, with MA(7) at $236.34, MA(25) at $189.46, and MA(99) at $117.88. The immediate battle is around the $373 high after this explosive rally. 📊
🔥 4H Chart: The trend is extremely steep, with price around $322 and all major moving averages far below. $250–$252 becomes an important area to watch if the market starts cooling, while a break above $373 would put fresh highs in focus. 🚀
🌍 1D Chart: The daily chart shows a massive breakout from the $55 area into the $300+ zone, supported by a huge volume spike. Momentum is clearly elevated, but such a rapid move can also bring sharp pullbacks and volatility. ⚠️
🎯 Key levels: Resistance $373 | Support zones $250–$252, then $179–$184. Watch price action and volume carefully rather than chasing a vertical candle. 💡
💬 What do you think — can $QNT break $373 and continue the rally, or are we due for a major pullback first? 🚀
#QNT #CryptoTrading #Binance
#StrategyStriveAdd2305BitcoinThisWeek #TrumpRejectsIranHormuzReopening #CircleTetherFreezeBitgetHackerWallet #CoinMarketCapCompletesCoinglassAcquisition
📈 Quant is showing an extraordinary move, trading around $324.47 after reaching a 24H high of $373.00. Volume has surged alongside price, making this one of the biggest momentum moves on the chart right now. ⚡
⏱️ 1H Chart: QNT has accelerated sharply above its moving averages, with MA(7) at $236.34, MA(25) at $189.46, and MA(99) at $117.88. The immediate battle is around the $373 high after this explosive rally. 📊
🔥 4H Chart: The trend is extremely steep, with price around $322 and all major moving averages far below. $250–$252 becomes an important area to watch if the market starts cooling, while a break above $373 would put fresh highs in focus. 🚀
🌍 1D Chart: The daily chart shows a massive breakout from the $55 area into the $300+ zone, supported by a huge volume spike. Momentum is clearly elevated, but such a rapid move can also bring sharp pullbacks and volatility. ⚠️
🎯 Key levels: Resistance $373 | Support zones $250–$252, then $179–$184. Watch price action and volume carefully rather than chasing a vertical candle. 💡
💬 What do you think — can $QNT break $373 and continue the rally, or are we due for a major pullback first? 🚀
#QNT #CryptoTrading #Binance
#StrategyStriveAdd2305BitcoinThisWeek #TrumpRejectsIranHormuzReopening #CircleTetherFreezeBitgetHackerWallet #CoinMarketCapCompletesCoinglassAcquisition