Your alt just pumped 40%.
The price chart says it is still 4x from the old high.
That number is the optimistic one.
An all time high is set at one specific supply.
After that, tokens unlock, emissions keep running, and some projects merge into a bigger float.
Same price, more coins, bigger market cap.
Here is the math in round numbers.
A coin tops at $10 with 100M tokens out.
That is a $1B peak.
Four years later, 200M tokens circulate.
$10 today is a $2B coin.
It has to be worth twice its best day just to tie the old print.
That is how this week's bounce actually reads.
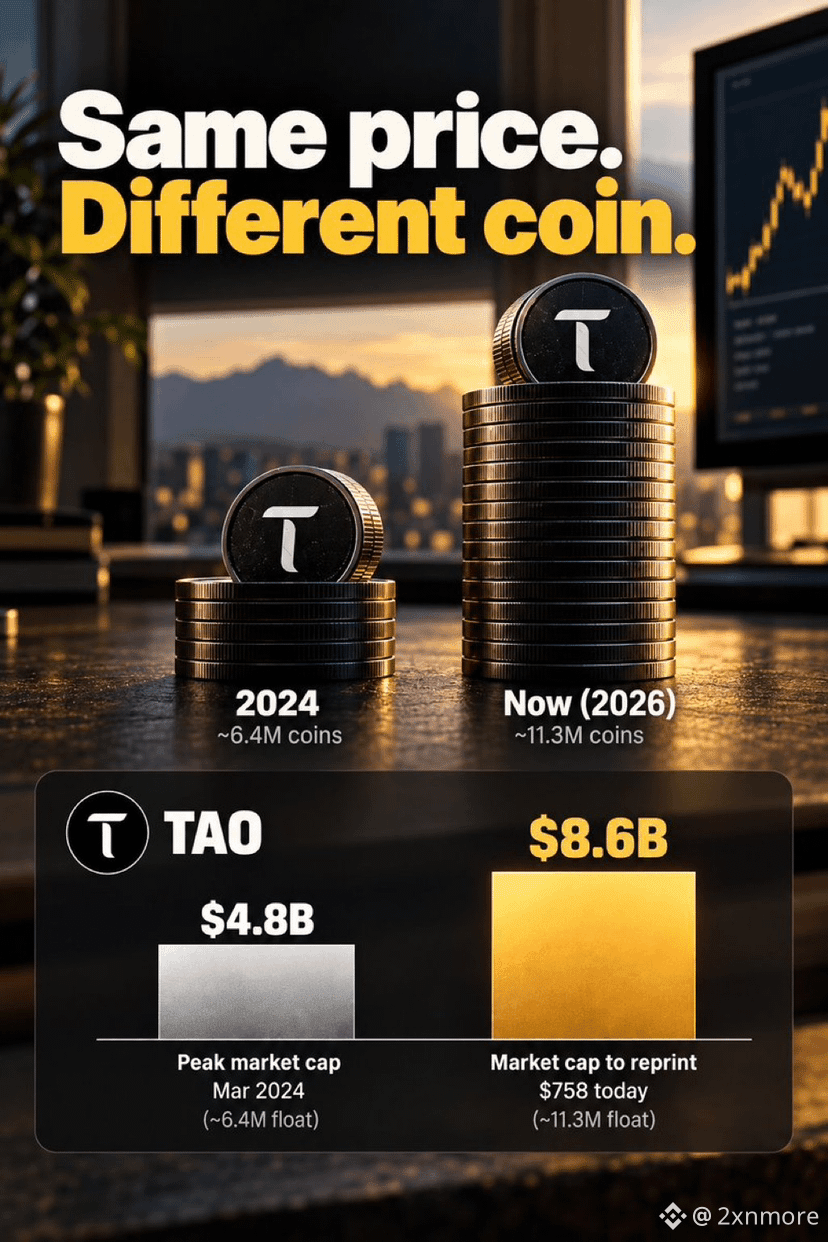
$TAO
Price to the Mar 2024 high: ~2.3x
Float then: ~6M
Float now: ~11.3M
Old peak cap: ~$4.5B
Cap needed to reprint $758: ~$8.6B
$SUI
Price to the Jan 2025 high: ~4.5x
Float then: ~3.0B
Float now: ~4.1B
Old peak cap: ~$16B
Cap needed to reprint $5.35: ~$22B
$AVAX
Price to the 2021 high: ~13x
Float then: ~224M
Float now: ~443M
Old peak cap: ~$32B
Cap needed to reprint $145: ~$64B
$FET
Price to the Mar 2024 high: ~14x
The ASI merger more than doubled the FET supply.
$3.45 on today's ~2.31B float is an ~$8B coin, not the cap it printed at the high.
None of that shows up on a price chart.
Then there is the overhead.
Holders who bought near the top want their money back. They sell the moment price tags their entry.
The longer a coin sits under the high, the thicker that wall gets.
Before you call any bounce a recovery, run four checks.
1. How many times does price need to multiply to reclaim the high?
2. How much has circulating supply grown since that high?
3. How much still unlocks or emits over the next 12 months?
4. Is demand coming from revenue and usage, or from last cycle's narrative?
If the answers come back big, big, big, and narrative, you are holding a bounce, not a recovery.
A price chart shows you how far a coin fell.
A supply chart shows you whether it can climb back.
Which name clears its old peak valuation first?
The price chart says it is still 4x from the old high.
That number is the optimistic one.
An all time high is set at one specific supply.
After that, tokens unlock, emissions keep running, and some projects merge into a bigger float.
Same price, more coins, bigger market cap.
Here is the math in round numbers.
A coin tops at $10 with 100M tokens out.
That is a $1B peak.
Four years later, 200M tokens circulate.
$10 today is a $2B coin.
It has to be worth twice its best day just to tie the old print.
That is how this week's bounce actually reads.
$TAO
Price to the Mar 2024 high: ~2.3x
Float then: ~6M
Float now: ~11.3M
Old peak cap: ~$4.5B
Cap needed to reprint $758: ~$8.6B
$SUI
Price to the Jan 2025 high: ~4.5x
Float then: ~3.0B
Float now: ~4.1B
Old peak cap: ~$16B
Cap needed to reprint $5.35: ~$22B
$AVAX
Price to the 2021 high: ~13x
Float then: ~224M
Float now: ~443M
Old peak cap: ~$32B
Cap needed to reprint $145: ~$64B
$FET
Price to the Mar 2024 high: ~14x
The ASI merger more than doubled the FET supply.
$3.45 on today's ~2.31B float is an ~$8B coin, not the cap it printed at the high.
None of that shows up on a price chart.
Then there is the overhead.
Holders who bought near the top want their money back. They sell the moment price tags their entry.
The longer a coin sits under the high, the thicker that wall gets.
Before you call any bounce a recovery, run four checks.
1. How many times does price need to multiply to reclaim the high?
2. How much has circulating supply grown since that high?
3. How much still unlocks or emits over the next 12 months?
4. Is demand coming from revenue and usage, or from last cycle's narrative?
If the answers come back big, big, big, and narrative, you are holding a bounce, not a recovery.
A price chart shows you how far a coin fell.
A supply chart shows you whether it can climb back.
Which name clears its old peak valuation first?