SOL holding above all EMAs, looking for a push
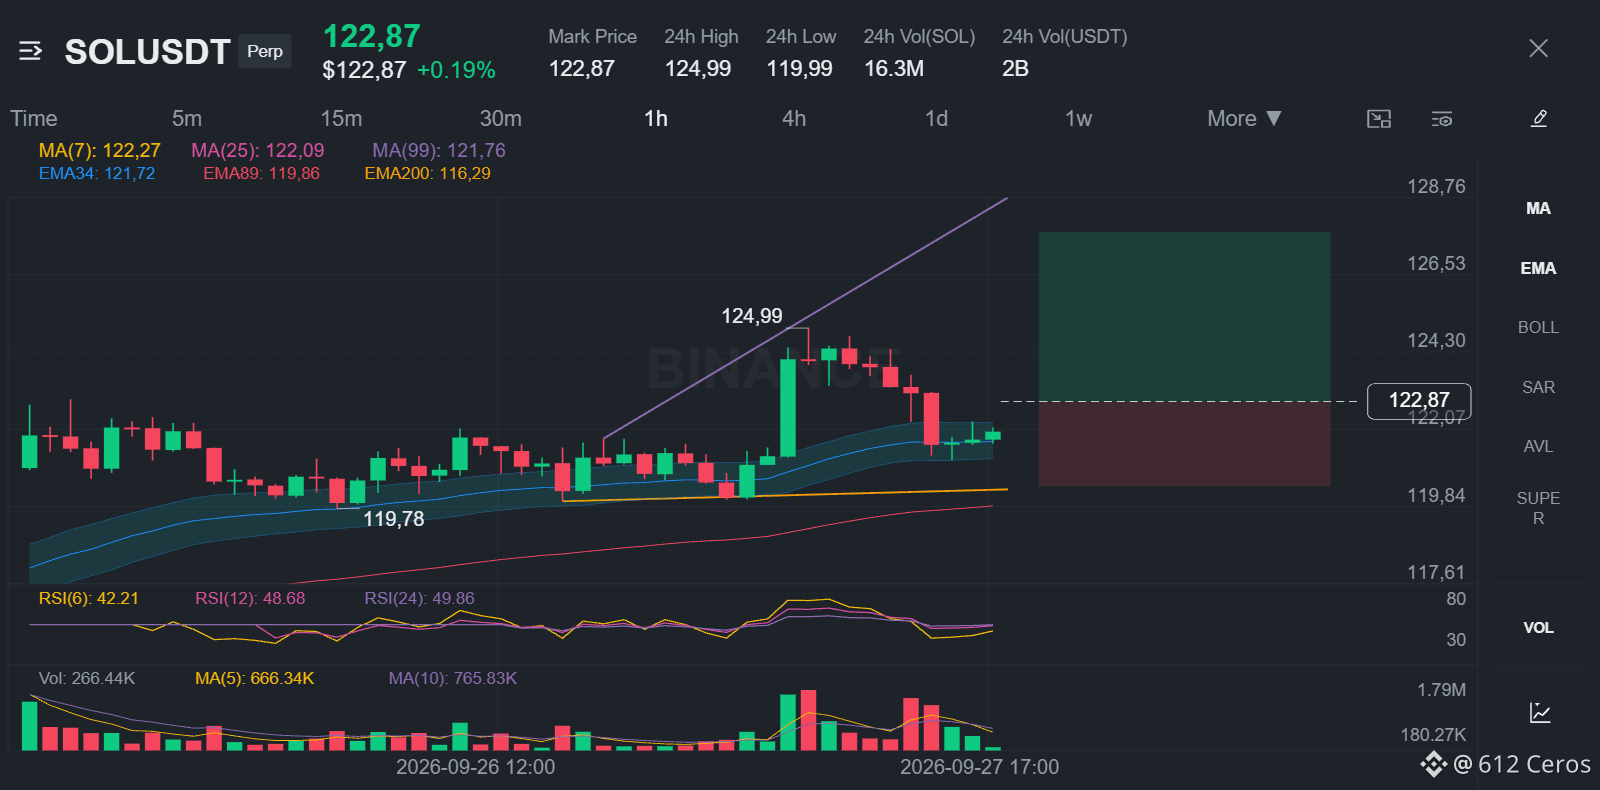
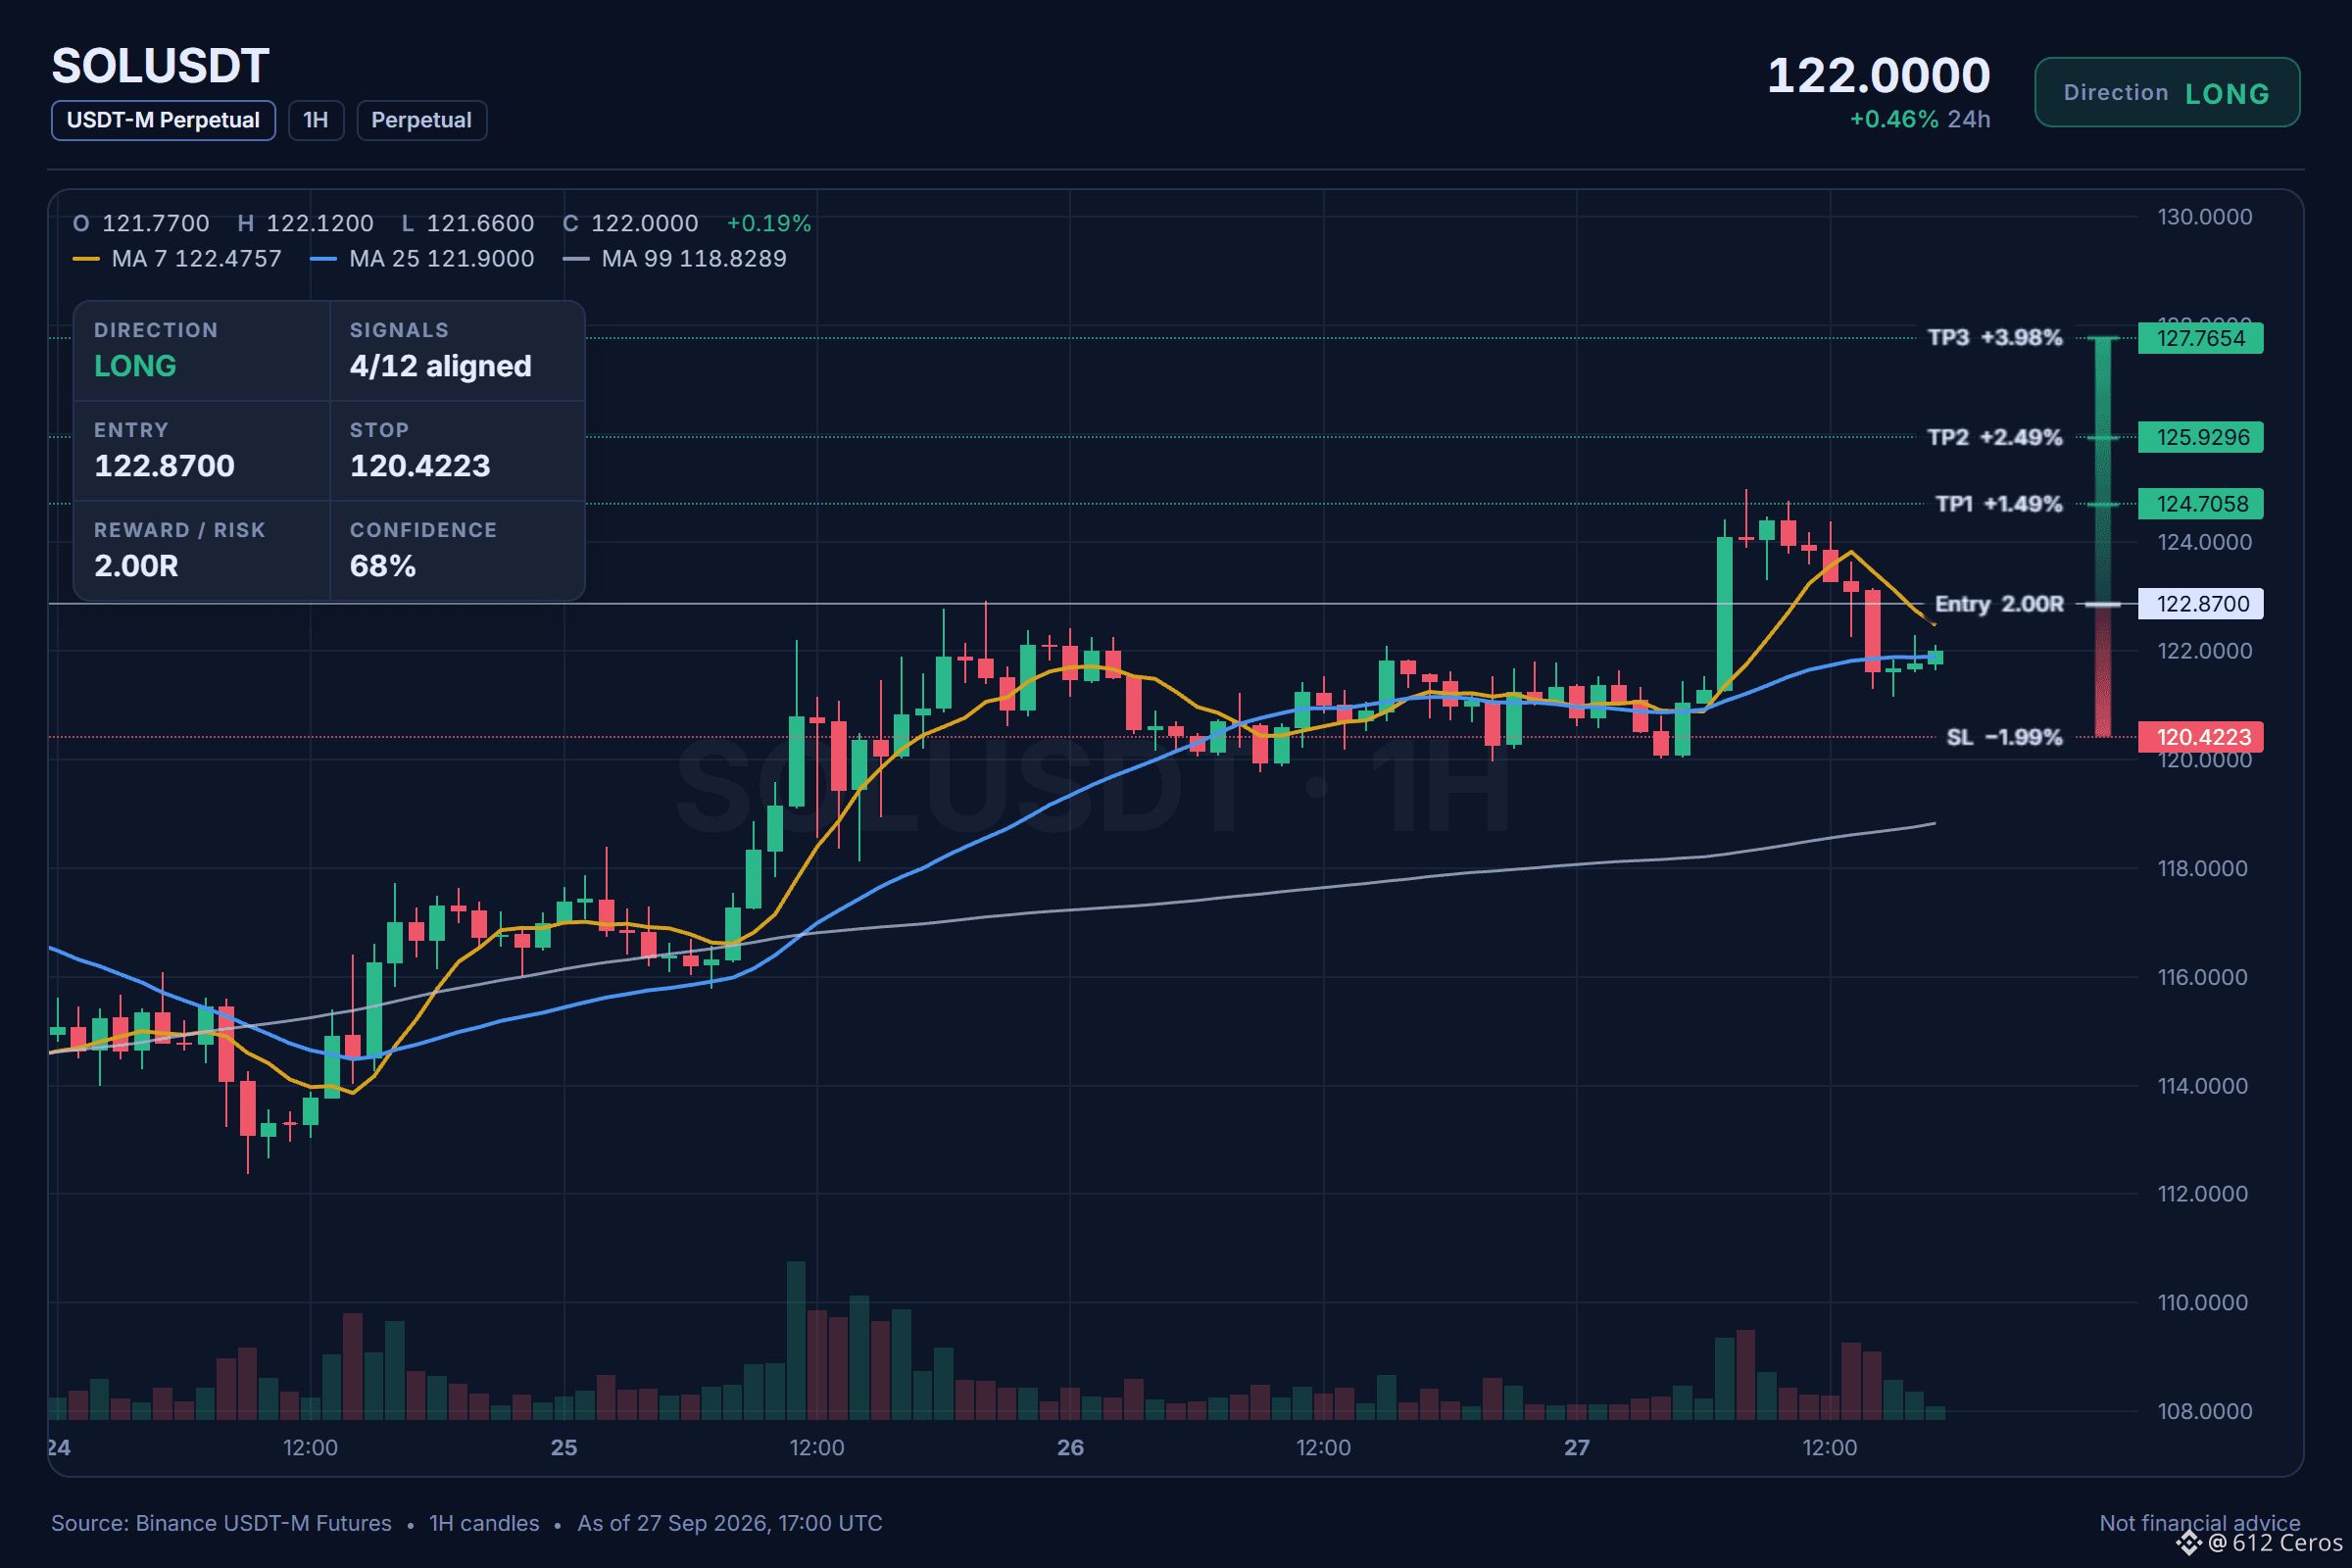
🟢 $SOL /USDT | Bias: LONG (Leaning) | 4/12 signals aligned
⚠️ Leaning only: 8 of 12 signals are still undecided. Keep size light.
Technical verdict: LEANING LONG. 4 of 12 signals aligned, 0 against.
✅ Daily trend: price > EMA50 > EMA200, bullish stack
✅ 4h trend: price > EMA50 > EMA200, bullish stack
✅ 1h trend: price > EMA50 > EMA200, bullish stack
✅ 4h RSI: 57.8, bullish momentum (above 55)
No factor points the other way right now.
Price map:
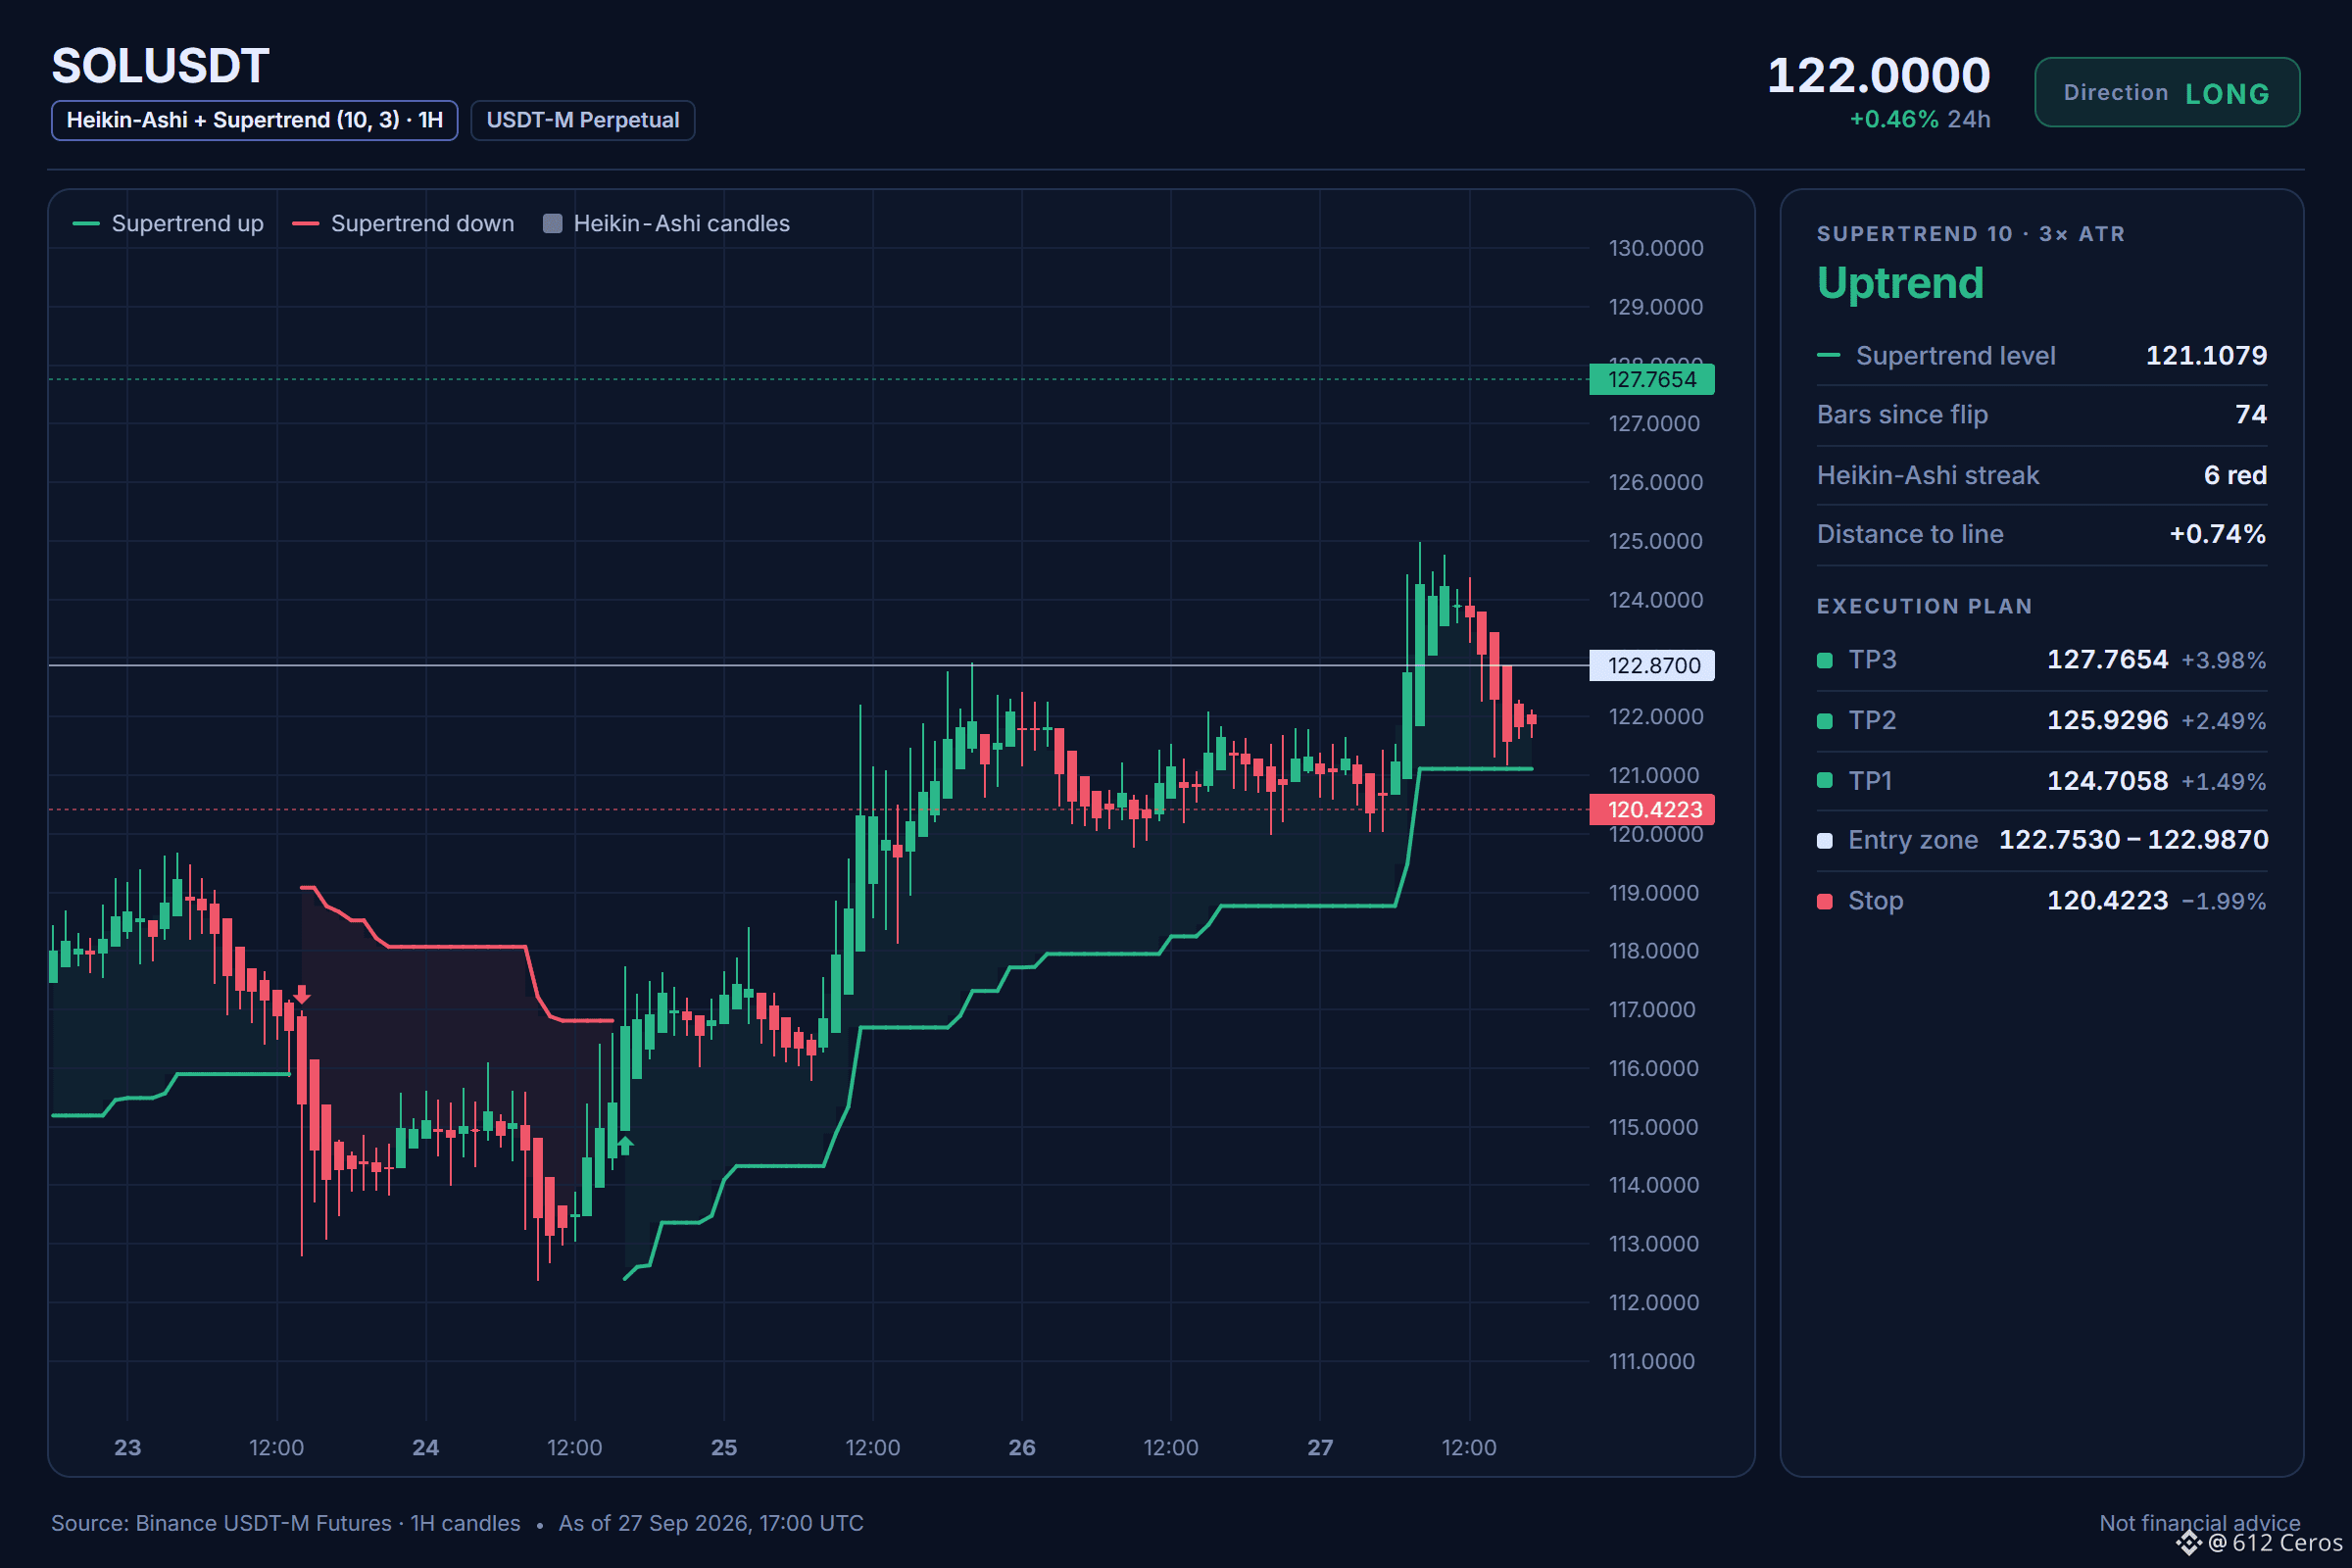
🎯 TP3: 127.7654
🎯 TP2: 125.9296
🎯 TP1: 124.7058
📍 Entry: 122.7530 – 122.9870
🛑 SL: 120.4223
Why this setup?
The daily trend is bullish with price above both EMA50 and EMA200, and the 1h trend matches with the same bullish stack. The 1h price sits at 122.87, which is our entry reference, with the 15m RSI at 50.36 sitting in neutral and the 1h ATR at 1.0196 defining a normal range. TP1 is at 124.7058 and TP2 is at 125.9296, while the invalidation level is 115.2534. The daily trend and 4h trend both show bullish stacks, and the 4h RSI is 57.8 with momentum above 55, but the 1h RSI is 50.4 in the neutral zone and the trend strength is lean with only 4 of 12 signals aligned. The main against factor is that BTC has no clear trend with a correlation of 0.77, so conviction is moderate and we invalidate at 115.2534.
Over to you:
What is your invalidation level for SOL if the daily stack breaks?
Chart with every level 👇
📲 Want more of my latest signals? Join me here:
https://app.binance.com/uni-qr/D26WbL9t
⚠️ Personal market analysis only. NFA — manage risk and DYOR.
Educational content, not investment advice or a recommendation to buy, sell, deposit, or withdraw any asset. No paid promotion or referral/affiliate links.
🟢 $SOL /USDT | Bias: LONG (Leaning) | 4/12 signals aligned
⚠️ Leaning only: 8 of 12 signals are still undecided. Keep size light.
Technical verdict: LEANING LONG. 4 of 12 signals aligned, 0 against.
✅ Daily trend: price > EMA50 > EMA200, bullish stack
✅ 4h trend: price > EMA50 > EMA200, bullish stack
✅ 1h trend: price > EMA50 > EMA200, bullish stack
✅ 4h RSI: 57.8, bullish momentum (above 55)
No factor points the other way right now.
Price map:
🎯 TP3: 127.7654
🎯 TP2: 125.9296
🎯 TP1: 124.7058
📍 Entry: 122.7530 – 122.9870
🛑 SL: 120.4223
Why this setup?
The daily trend is bullish with price above both EMA50 and EMA200, and the 1h trend matches with the same bullish stack. The 1h price sits at 122.87, which is our entry reference, with the 15m RSI at 50.36 sitting in neutral and the 1h ATR at 1.0196 defining a normal range. TP1 is at 124.7058 and TP2 is at 125.9296, while the invalidation level is 115.2534. The daily trend and 4h trend both show bullish stacks, and the 4h RSI is 57.8 with momentum above 55, but the 1h RSI is 50.4 in the neutral zone and the trend strength is lean with only 4 of 12 signals aligned. The main against factor is that BTC has no clear trend with a correlation of 0.77, so conviction is moderate and we invalidate at 115.2534.
Over to you:
What is your invalidation level for SOL if the daily stack breaks?
Chart with every level 👇
📲 Want more of my latest signals? Join me here:
https://app.binance.com/uni-qr/D26WbL9t
⚠️ Personal market analysis only. NFA — manage risk and DYOR.
Educational content, not investment advice or a recommendation to buy, sell, deposit, or withdraw any asset. No paid promotion or referral/affiliate links.