DOT/USDT: BULLISH MOMENTUM FACES A CRITICAL TEST!
DOT is recovering strongly, but buyers are approaching an important resistance zone.
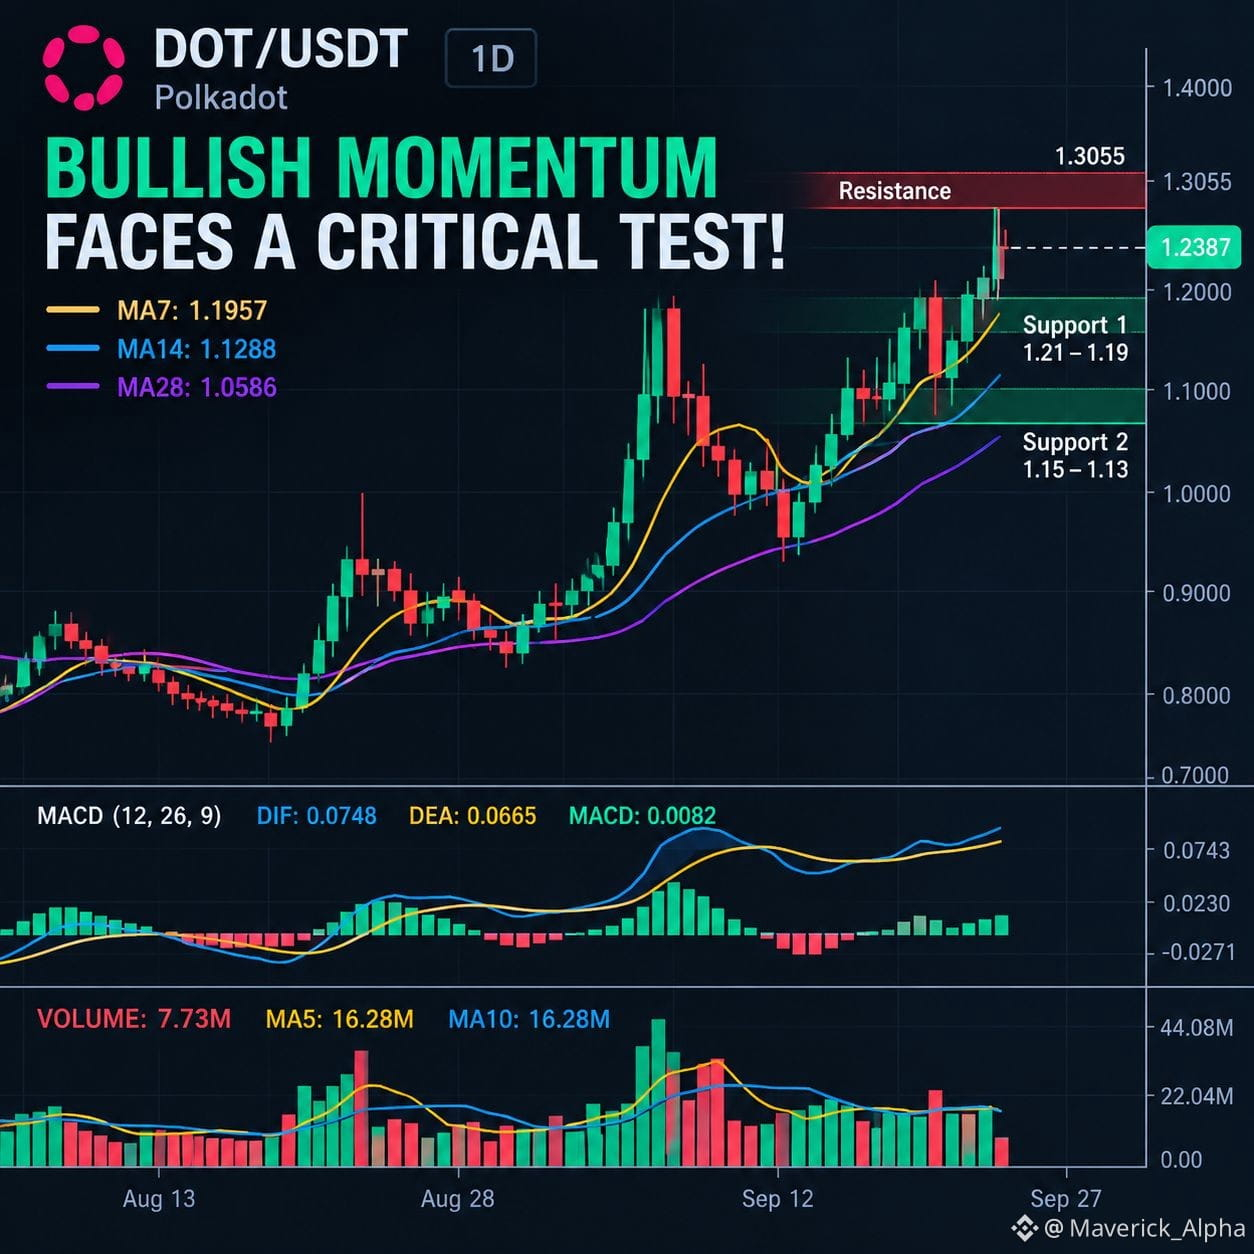
1D chart shows DOT at $1.2387, trading above its 7-day, 14-day and 28-day moving averages. This bullish alignment suggests improving short-term market structure.
However, the recent high at $1.3055 remains the key obstacle. The MACD histogram is positive at 0.0082, although the displayed volume of 7.73M DOT is below its 5-day average of 16.28M.
MARKET READ
Pair: DOT/USDT
Timeframe: 1D
Bias: BULLISH — WAIT FOR CONFIRMATION
Current chart price: $1.2387
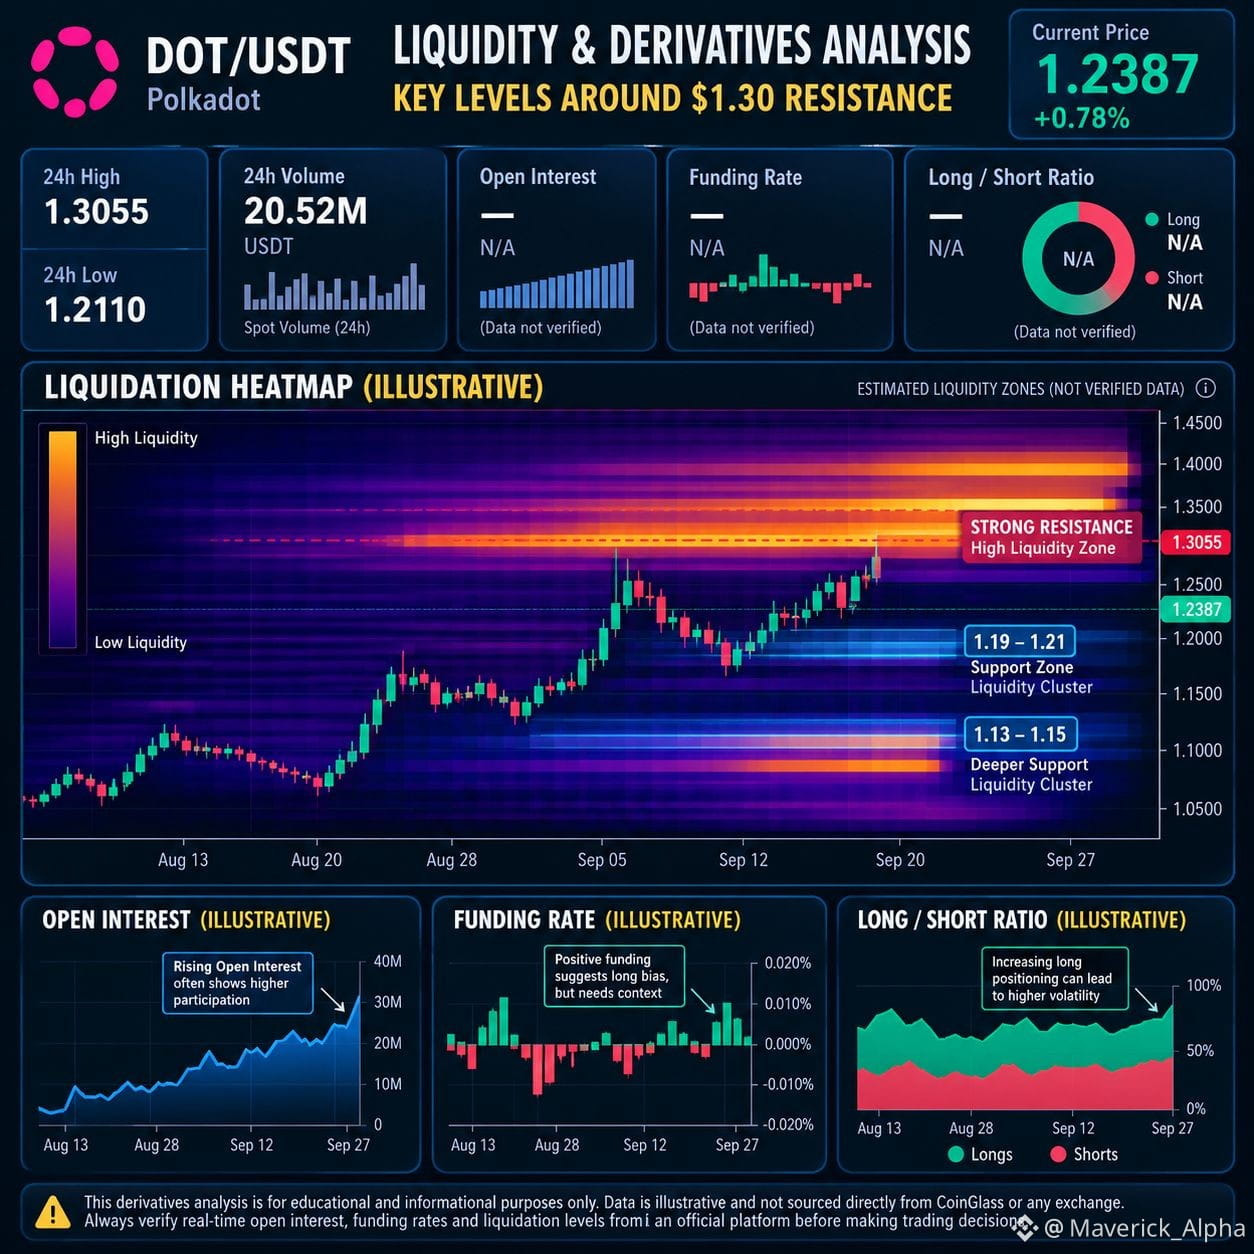
Immediate support: $1.21–$1.19
Secondary support: $1.13–$1.15
Major resistance: $1.3055
BULLISH SCENARIO
A daily close above $1.3055, supported by expanding volume, would confirm a stronger breakout attempt. A successful retest of that level as support would provide additional confirmation.
BEARISH SCENARIO
Rejection near $1.30 followed by a loss of $1.19 could weaken the recovery and expose the $1.13–$1.15 support region.
MY FINAL TAKE
DOT's improving daily structure is encouraging, but declining volume relative to its recent average makes confirmation essential. The next decisive move around $1.3055 could determine whether this recovery develops into a sustained breakout or another rejection.
Will DOT break above $1.3055 with strong volume or face another pullback?
#DOT #TradingSignal
$DOT
DOT is recovering strongly, but buyers are approaching an important resistance zone.
1D chart shows DOT at $1.2387, trading above its 7-day, 14-day and 28-day moving averages. This bullish alignment suggests improving short-term market structure.
However, the recent high at $1.3055 remains the key obstacle. The MACD histogram is positive at 0.0082, although the displayed volume of 7.73M DOT is below its 5-day average of 16.28M.
MARKET READ
Pair: DOT/USDT
Timeframe: 1D
Bias: BULLISH — WAIT FOR CONFIRMATION
Current chart price: $1.2387
Immediate support: $1.21–$1.19
Secondary support: $1.13–$1.15
Major resistance: $1.3055
BULLISH SCENARIO
A daily close above $1.3055, supported by expanding volume, would confirm a stronger breakout attempt. A successful retest of that level as support would provide additional confirmation.
BEARISH SCENARIO
Rejection near $1.30 followed by a loss of $1.19 could weaken the recovery and expose the $1.13–$1.15 support region.
MY FINAL TAKE
DOT's improving daily structure is encouraging, but declining volume relative to its recent average makes confirmation essential. The next decisive move around $1.3055 could determine whether this recovery develops into a sustained breakout or another rejection.
Will DOT break above $1.3055 with strong volume or face another pullback?
#DOT #TradingSignal
$DOT