XRP price is building bullish pressure on the daily trend
🟢 $XRP /USDT | Bias: LONG (Strong) | 6/12 signals aligned
Technical verdict: STRONG LONG. 6 of 12 signals aligned, 1 against.
What supports it (6):
• Daily trend: price > EMA50 > EMA200, bullish stack
• 4h trend: price > EMA50 > EMA200, bullish stack
• 1h trend: price > EMA50 > EMA200, bullish stack
• Trend strength (ADX/DI, 15m): ADX 29.6 with buyers in control (DI+ 28.7 vs DI− 11.8)
• BTC backdrop: BTC trend is bullish and correlation is 0.78
• 1h RSI: 55.6, bullish momentum (above 55)
What argues against (1):
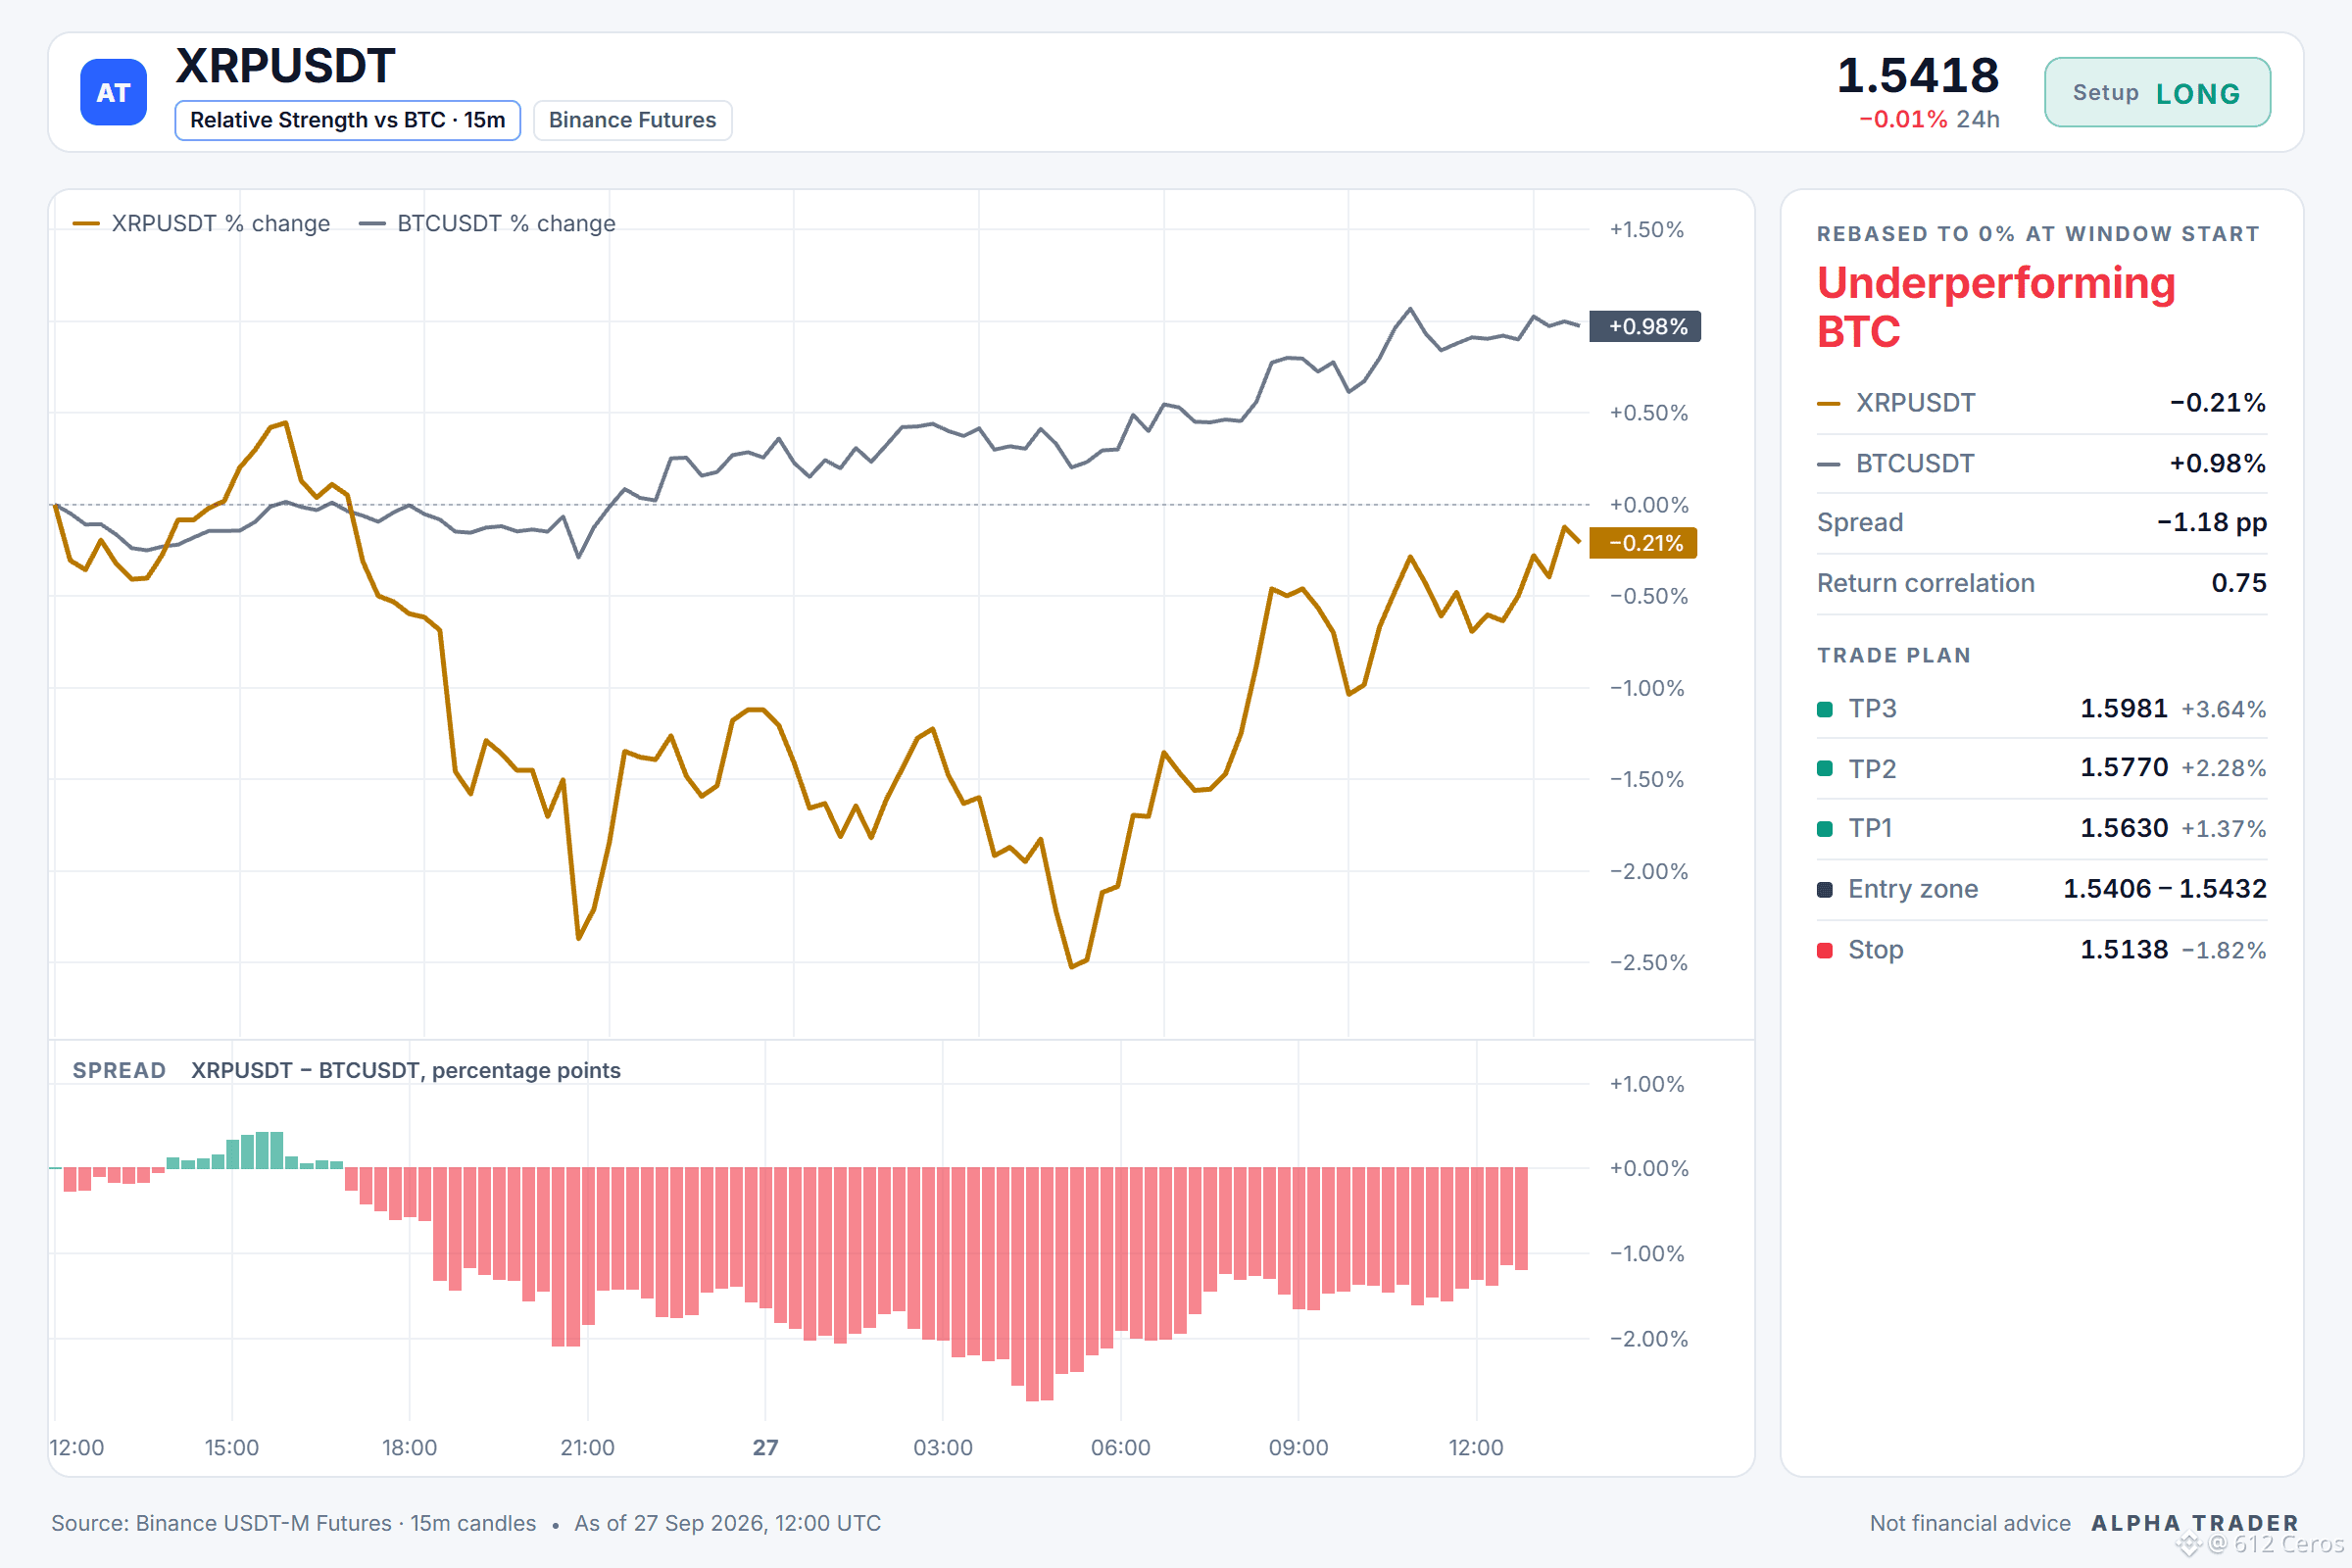
• Relative strength vs BTC: underperforming, −1.02% vs BTC over the last day
Setup levels:
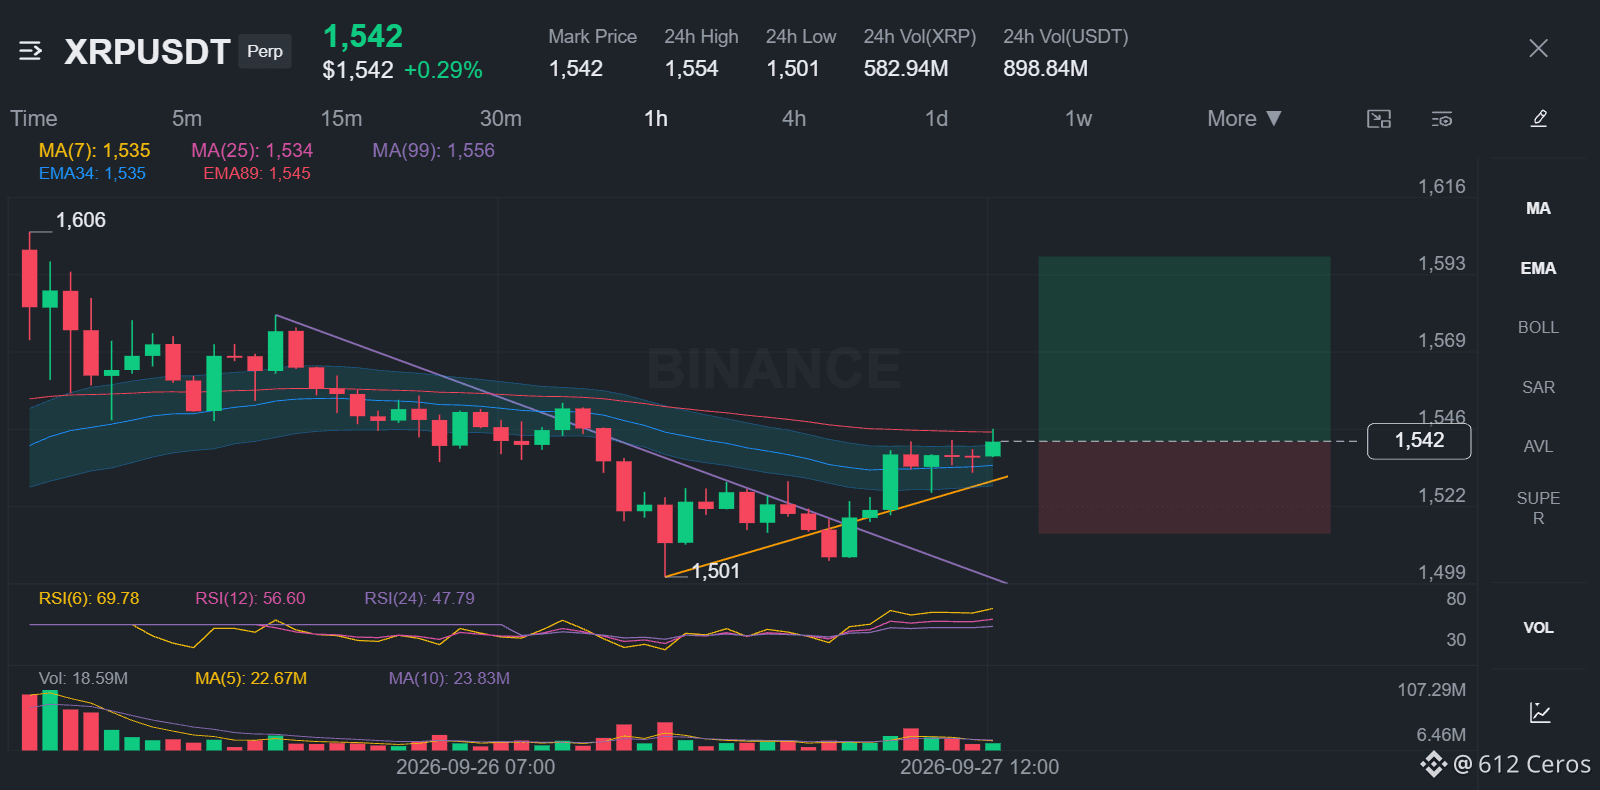
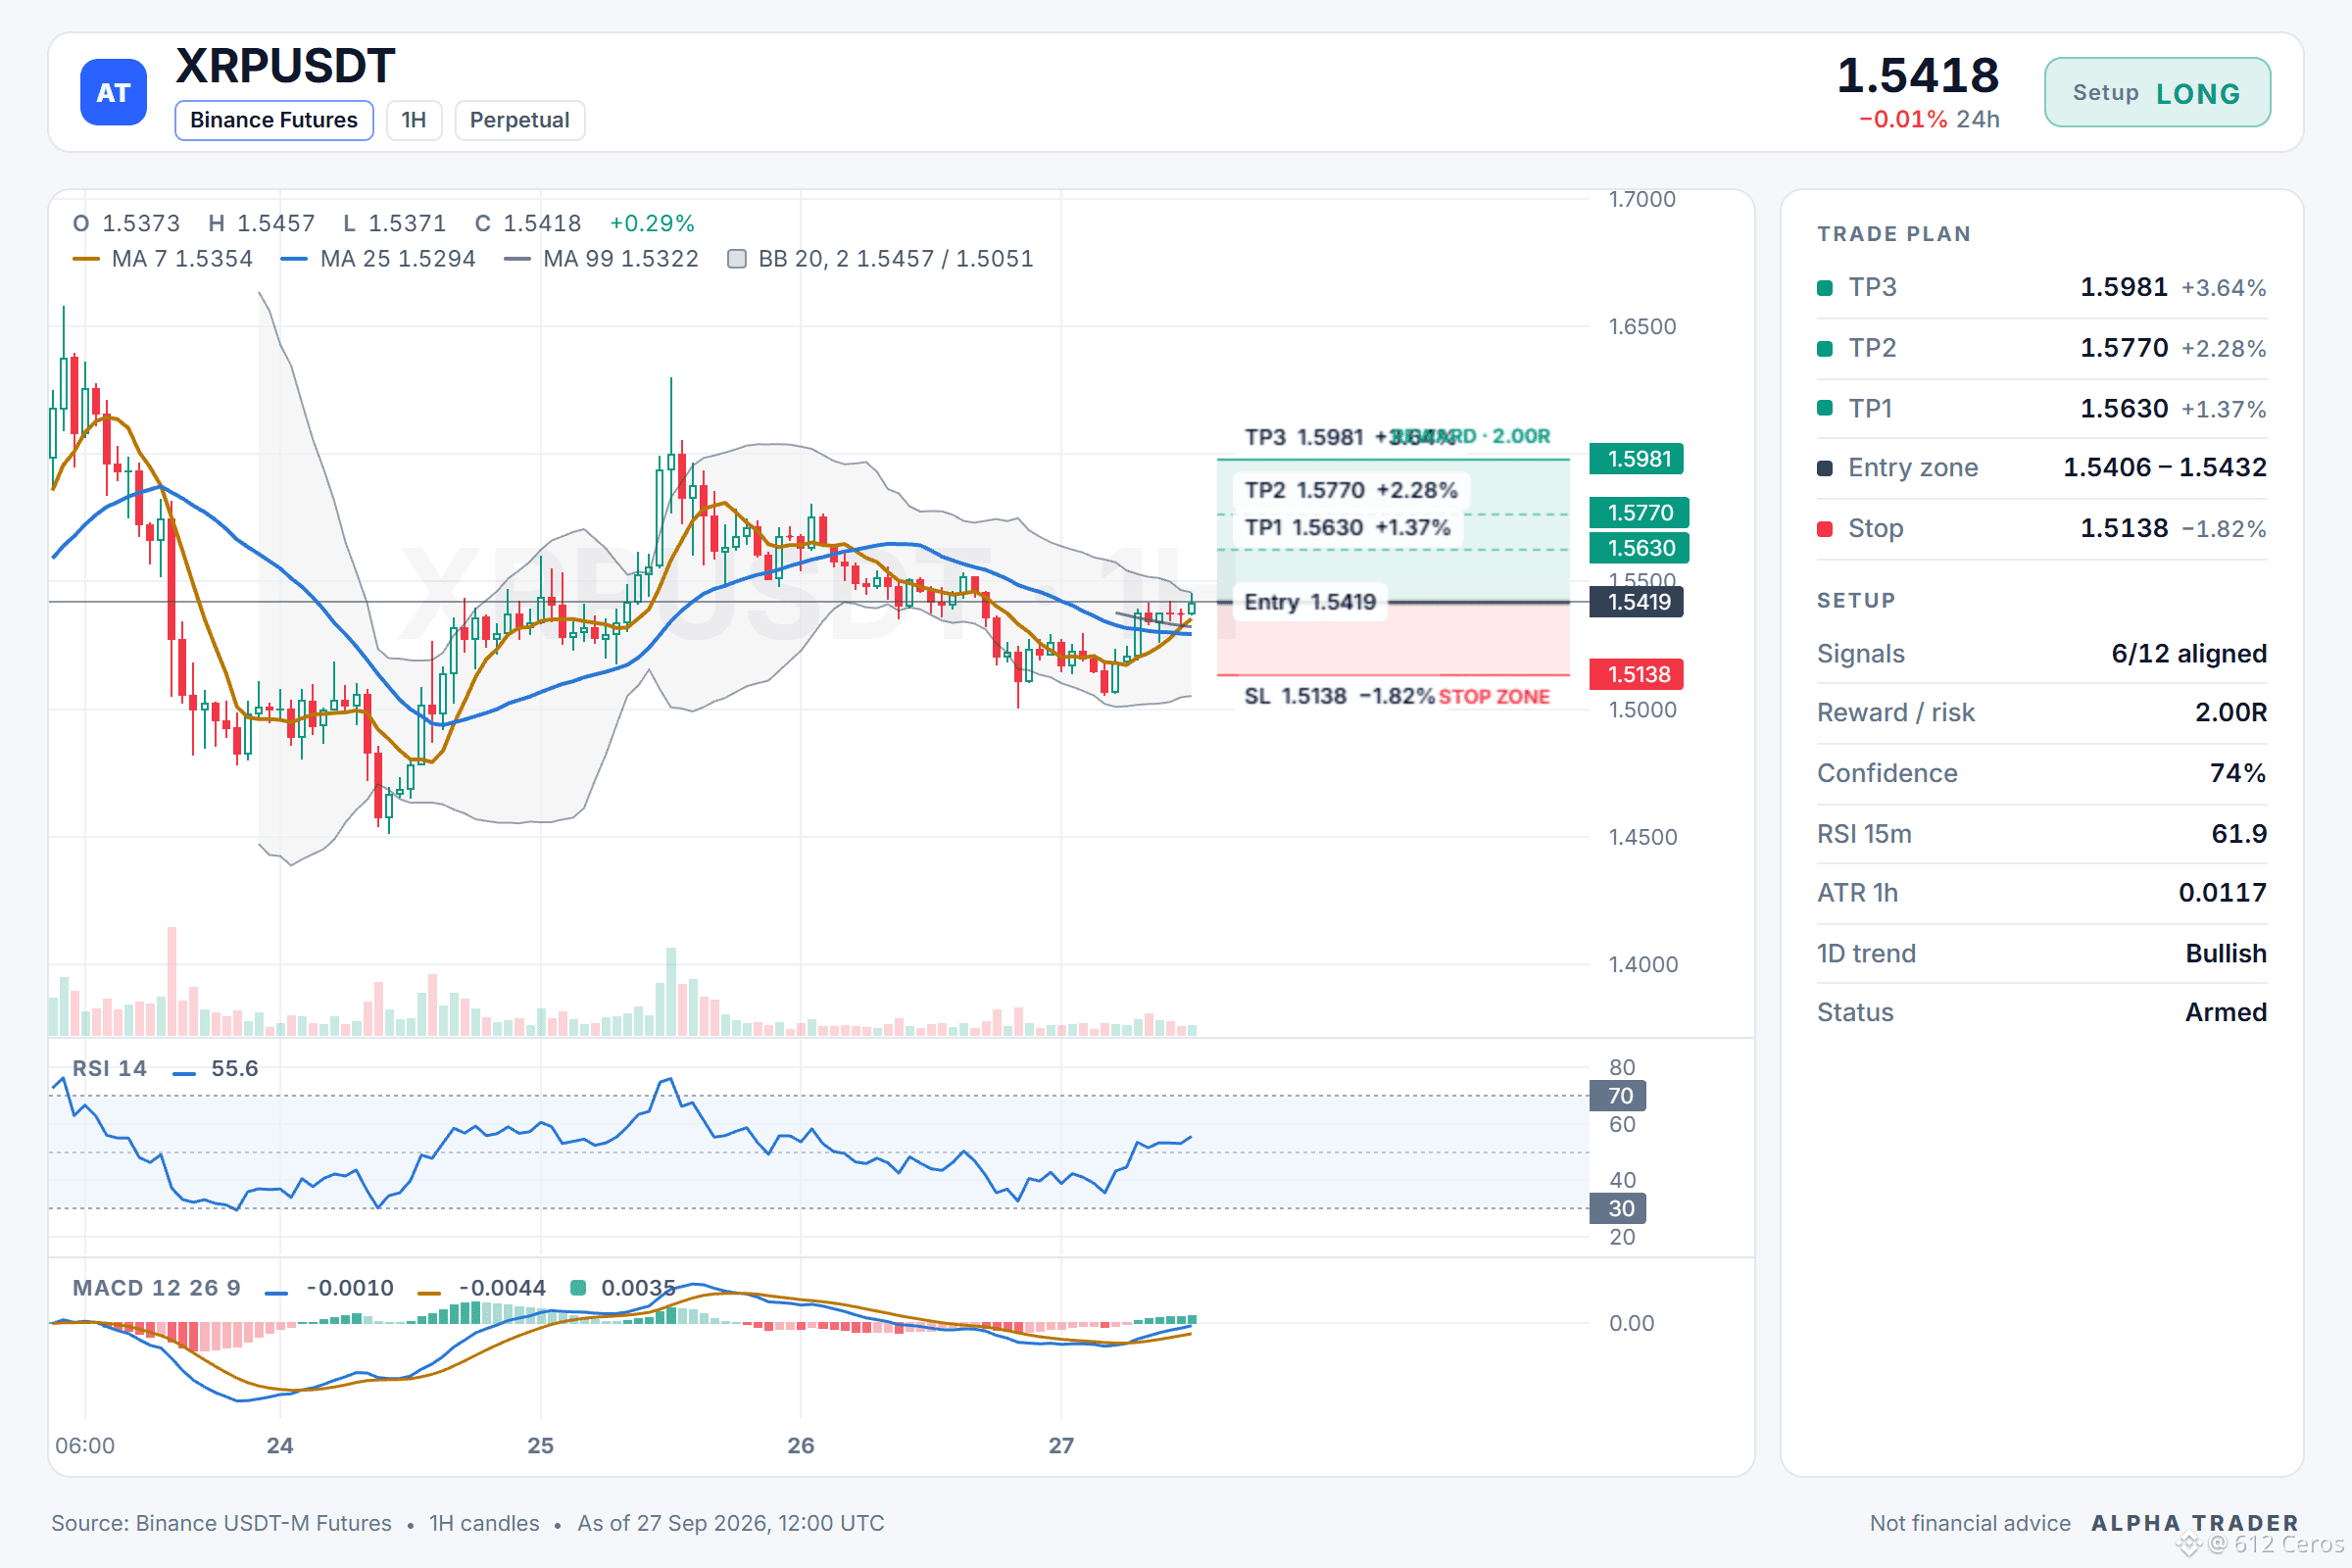
Entry: 1.5406 – 1.5432
SL: 1.5138
TP1: 1.5630
TP2: 1.5770
TP3: 1.5981
Why this setup?
The daily trend and the 4h trend are both bullish, with price stacked above EMA50 and EMA200 on those frames, which gives the setup a multi-timeframe bias. The 1h trend is also bullish, and the 1h RSI sits at 55.6, showing real bullish momentum rather than a neutral drift. The 1h ATR is 0.011714, so the entry zone around 1.5419 offers a precise, volatility-defined fill. TP1 is 1.5630 and TP2 is 1.5770, while the invalidation level sits at 1.4876, defining the risk for this trade.
Your call:
Where do you set your invalidation if the daily structure breaks, and is 1.4876 too tight for your risk?
Chart with every level 👇
📲 Want more of my latest signals? Join me here:
https://app.binance.com/uni-qr/D26WbL9t
⚠️ Personal market analysis only. NFA — manage risk and DYOR.
Educational content, not investment advice or a recommendation to buy, sell, deposit, or withdraw any asset. No paid promotion; the invite link above is my own referral link, and I may earn a commission if you sign up through it — at no extra cost to you.
🟢 $XRP /USDT | Bias: LONG (Strong) | 6/12 signals aligned
Technical verdict: STRONG LONG. 6 of 12 signals aligned, 1 against.
What supports it (6):
• Daily trend: price > EMA50 > EMA200, bullish stack
• 4h trend: price > EMA50 > EMA200, bullish stack
• 1h trend: price > EMA50 > EMA200, bullish stack
• Trend strength (ADX/DI, 15m): ADX 29.6 with buyers in control (DI+ 28.7 vs DI− 11.8)
• BTC backdrop: BTC trend is bullish and correlation is 0.78
• 1h RSI: 55.6, bullish momentum (above 55)
What argues against (1):
• Relative strength vs BTC: underperforming, −1.02% vs BTC over the last day
Setup levels:
Entry: 1.5406 – 1.5432
SL: 1.5138
TP1: 1.5630
TP2: 1.5770
TP3: 1.5981
Why this setup?
The daily trend and the 4h trend are both bullish, with price stacked above EMA50 and EMA200 on those frames, which gives the setup a multi-timeframe bias. The 1h trend is also bullish, and the 1h RSI sits at 55.6, showing real bullish momentum rather than a neutral drift. The 1h ATR is 0.011714, so the entry zone around 1.5419 offers a precise, volatility-defined fill. TP1 is 1.5630 and TP2 is 1.5770, while the invalidation level sits at 1.4876, defining the risk for this trade.
Your call:
Where do you set your invalidation if the daily structure breaks, and is 1.4876 too tight for your risk?
Chart with every level 👇
📲 Want more of my latest signals? Join me here:
https://app.binance.com/uni-qr/D26WbL9t
⚠️ Personal market analysis only. NFA — manage risk and DYOR.
Educational content, not investment advice or a recommendation to buy, sell, deposit, or withdraw any asset. No paid promotion; the invite link above is my own referral link, and I may earn a commission if you sign up through it — at no extra cost to you.