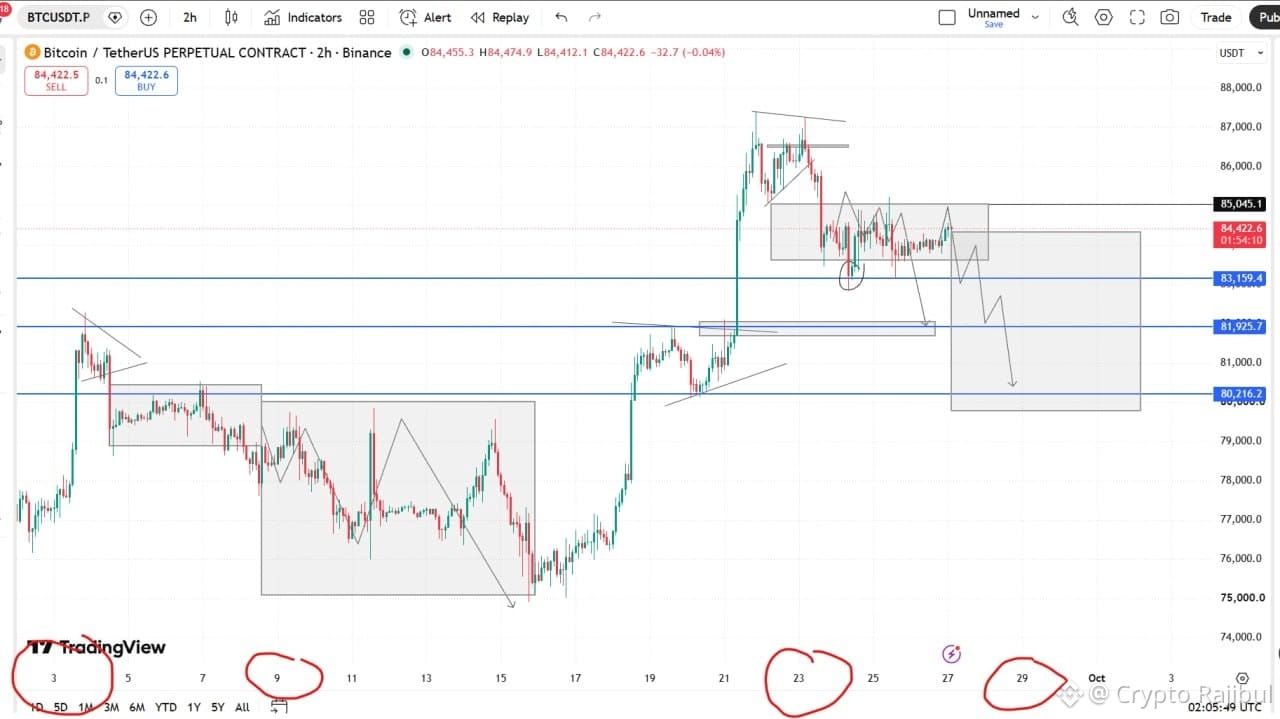
BTC Date-Time Analysis: History Rhyming?
I noticed an interesting similarity in BTC’s recent price action.
If we look at the date-time structure, the current movement looks quite similar to what happened around two weeks ago.
📌 September 3:
BTC formed a local Q1 around the weekend, followed by roughly a week of sideways consolidation.
Then, starting around September 9, the market entered a correction phase.
Fast forward to now:
📌 September 21:
BTC formed another peak around the weekend, followed by several days of sideways price action.
If this time-cycle pattern continues to rhyme with the previous move, we could potentially see a correction starting around the next weekday / month-end period.
Nothing is guaranteed — this is simply a pattern I’m watching.
Be careful with alts that have already pumped hard.
Don’t let FOMO convince you to blindly chase longs.
Let the market confirm the move first.
$BTC
📈$QNT
$US
I noticed an interesting similarity in BTC’s recent price action.
If we look at the date-time structure, the current movement looks quite similar to what happened around two weeks ago.
📌 September 3:
BTC formed a local Q1 around the weekend, followed by roughly a week of sideways consolidation.
Then, starting around September 9, the market entered a correction phase.
Fast forward to now:
📌 September 21:
BTC formed another peak around the weekend, followed by several days of sideways price action.
If this time-cycle pattern continues to rhyme with the previous move, we could potentially see a correction starting around the next weekday / month-end period.
Nothing is guaranteed — this is simply a pattern I’m watching.
Be careful with alts that have already pumped hard.
Don’t let FOMO convince you to blindly chase longs.
Let the market confirm the move first.
$BTC
📈$QNT
$US