LTC ANALYSIS CHART LONG TERM
$LTC
LTC/USDT 4H analysis
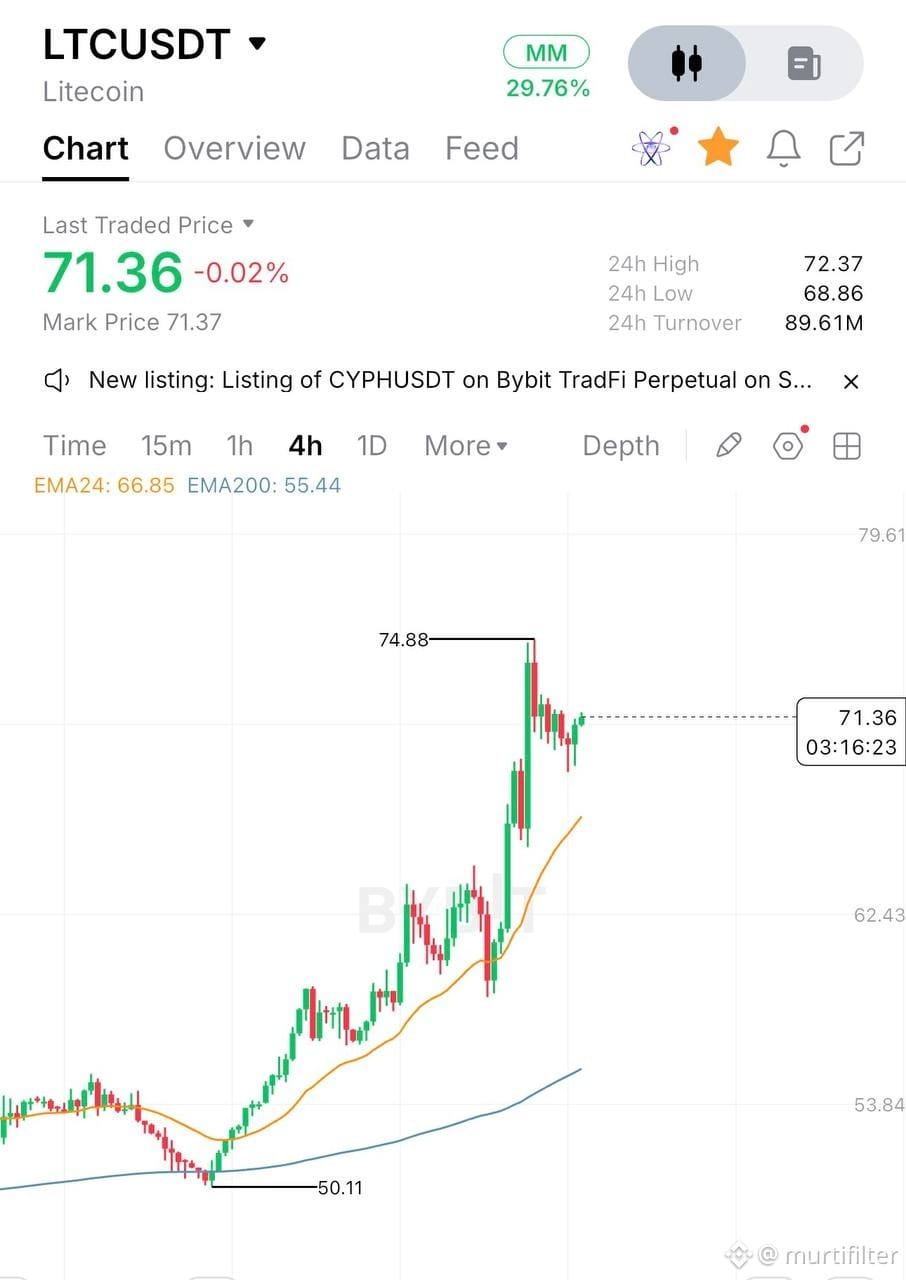
Litecoin shows a strong bullish structure on the 4H chart, rallying from Price currently sits at $`71.36, consolidating after the sharp advance.
Both EMAs are rising and act as dynamic support: EMA24 at $66.85** and EMA200 at **$55.44.
Price remains comfortably above them, confirming the uptrend.
Near-term resistance is the recent high at `$74.88.
A clean break above could extend the move higher, while a drop below EMA24 would signal short-term weakness. Momentum favors the bulls as long as price holds above the rising average.
#CircleMints500MUSDCOnSolana
#PolymarketBankFailureBetsDrawFDICConcern
#BlackRockBuildsTokenizedPortfoliosForOndo
#BitwiseFilesToListNEARETFOnNYSEArca
#SECCommissionerPeirceToLeaveOct2
$LTC
LTC/USDT 4H analysis
Litecoin shows a strong bullish structure on the 4H chart, rallying from Price currently sits at $`71.36, consolidating after the sharp advance.
Both EMAs are rising and act as dynamic support: EMA24 at $66.85** and EMA200 at **$55.44.
Price remains comfortably above them, confirming the uptrend.
Near-term resistance is the recent high at `$74.88.
A clean break above could extend the move higher, while a drop below EMA24 would signal short-term weakness. Momentum favors the bulls as long as price holds above the rising average.
#CircleMints500MUSDCOnSolana
#PolymarketBankFailureBetsDrawFDICConcern
#BlackRockBuildsTokenizedPortfoliosForOndo
#BitwiseFilesToListNEARETFOnNYSEArca
#SECCommissionerPeirceToLeaveOct2