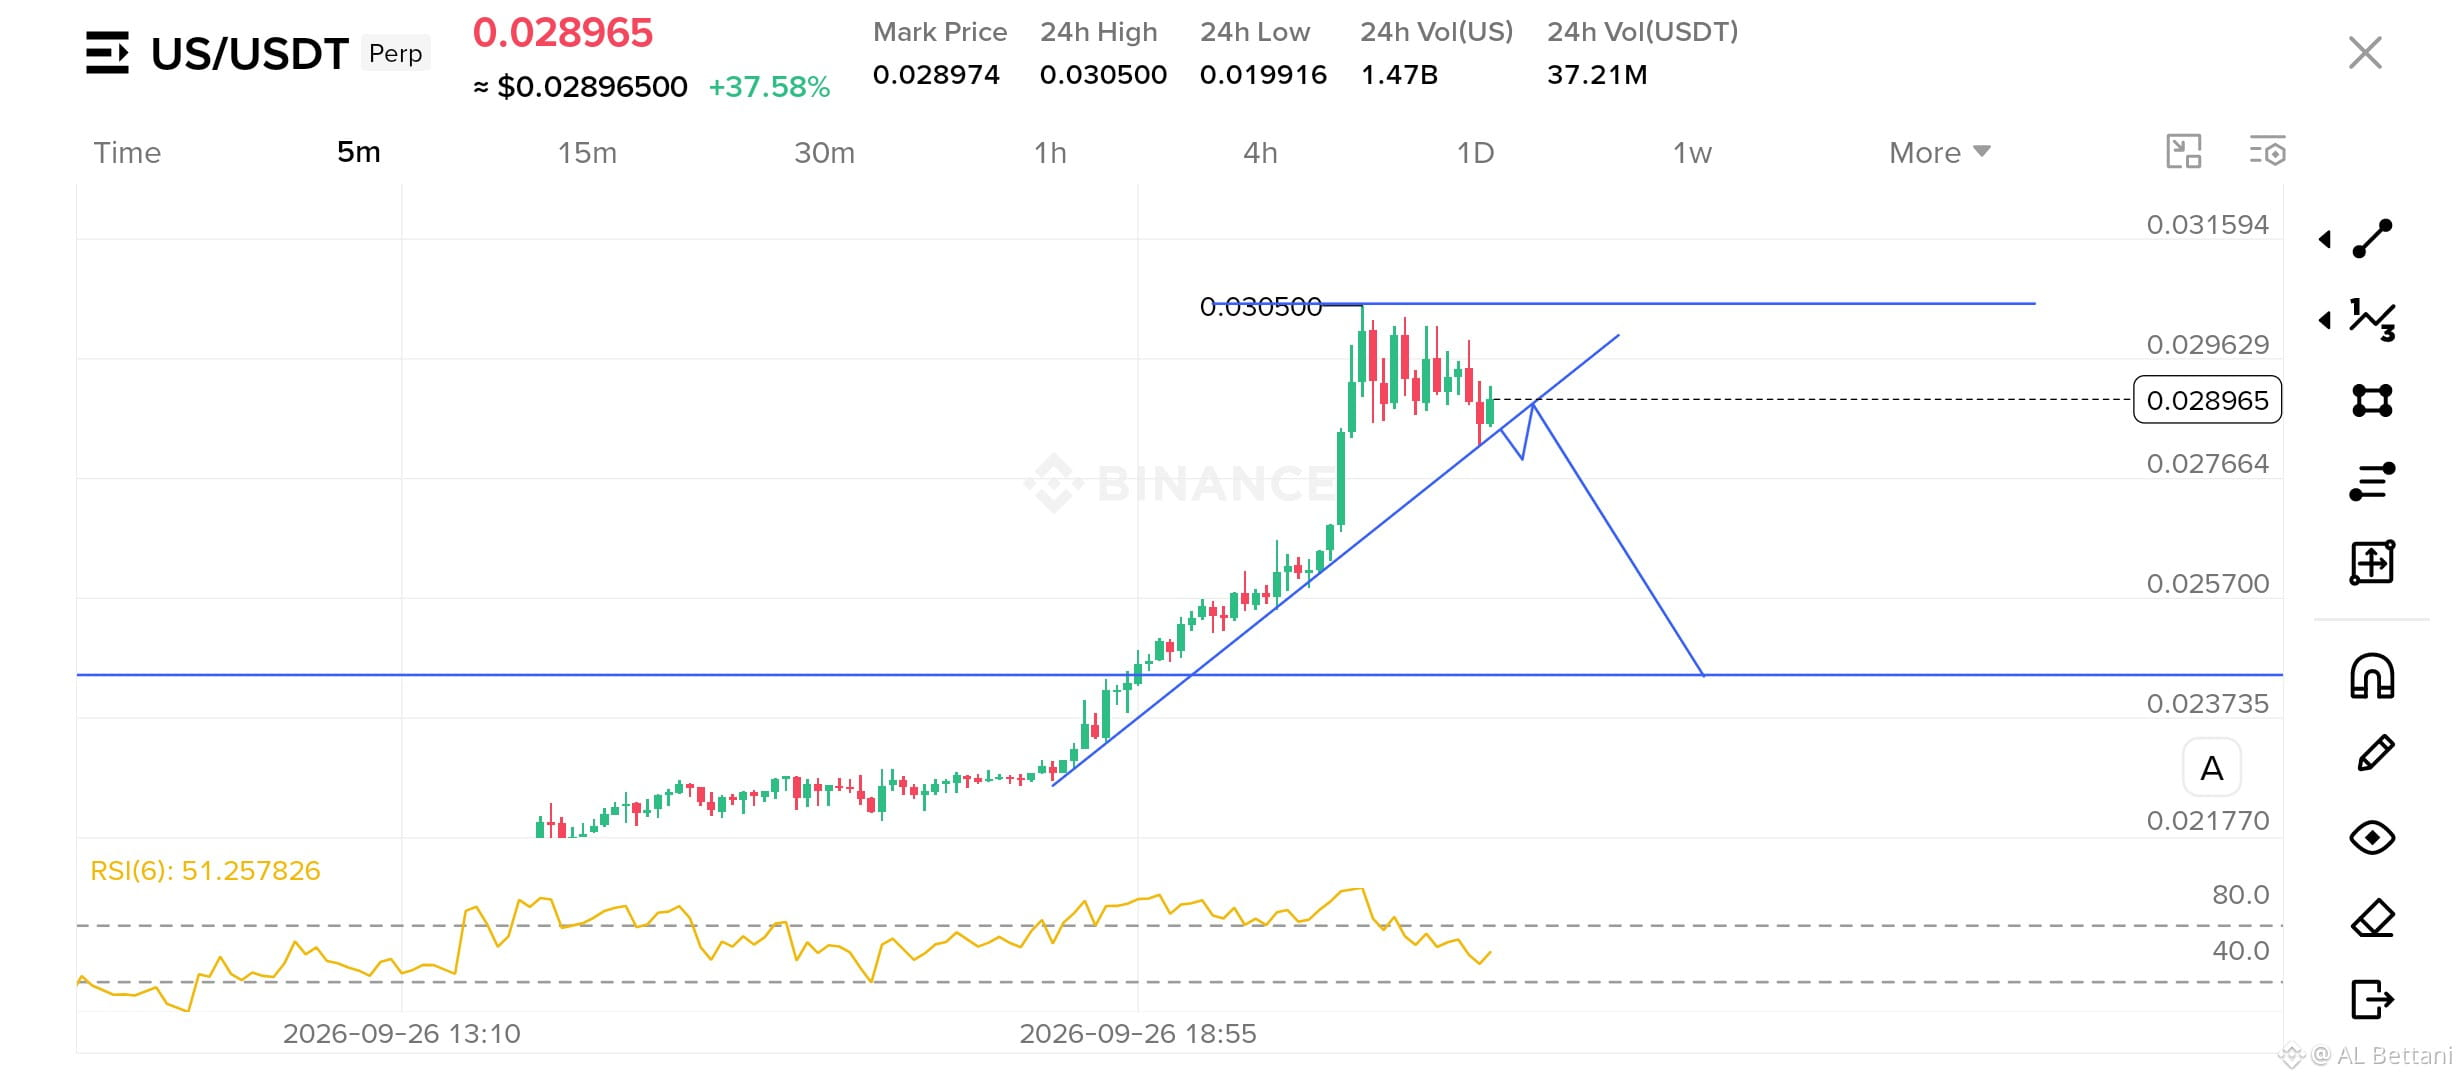
US/USDT 5m Chart Analysis: Massive Pump & Retracement Setup? 🚀
Taking a look at the $US 5-minute timeframe, the price is currently trading at $0.028965 with an incredible +37.58% gain over the last 24 hours. The chart shows a sharp upward surge reaching a 24h high of $0.030500, followed by a potential pullback and correction path mapped out above.
Current Price: $0.028965
24h High / Low: $0.030500 / $0.019916
Key Support Zone: Around $0.023735
Immediate Resistance: Near $0.029629 - $0.030500
RSI(6) is currently sitting at 51.25, showing balanced short-term momentum after a heavy pump. Keep these crucial levels on your watch list for intraday moves.
What is your next target for $US ? Drop your thoughts below! 👇
#US #CryptoTrading #BinanceSquare #TechnicalAnalysis #Altcoins $US
Taking a look at the $US 5-minute timeframe, the price is currently trading at $0.028965 with an incredible +37.58% gain over the last 24 hours. The chart shows a sharp upward surge reaching a 24h high of $0.030500, followed by a potential pullback and correction path mapped out above.
Current Price: $0.028965
24h High / Low: $0.030500 / $0.019916
Key Support Zone: Around $0.023735
Immediate Resistance: Near $0.029629 - $0.030500
RSI(6) is currently sitting at 51.25, showing balanced short-term momentum after a heavy pump. Keep these crucial levels on your watch list for intraday moves.
What is your next target for $US ? Drop your thoughts below! 👇
#US #CryptoTrading #BinanceSquare #TechnicalAnalysis #Altcoins $US