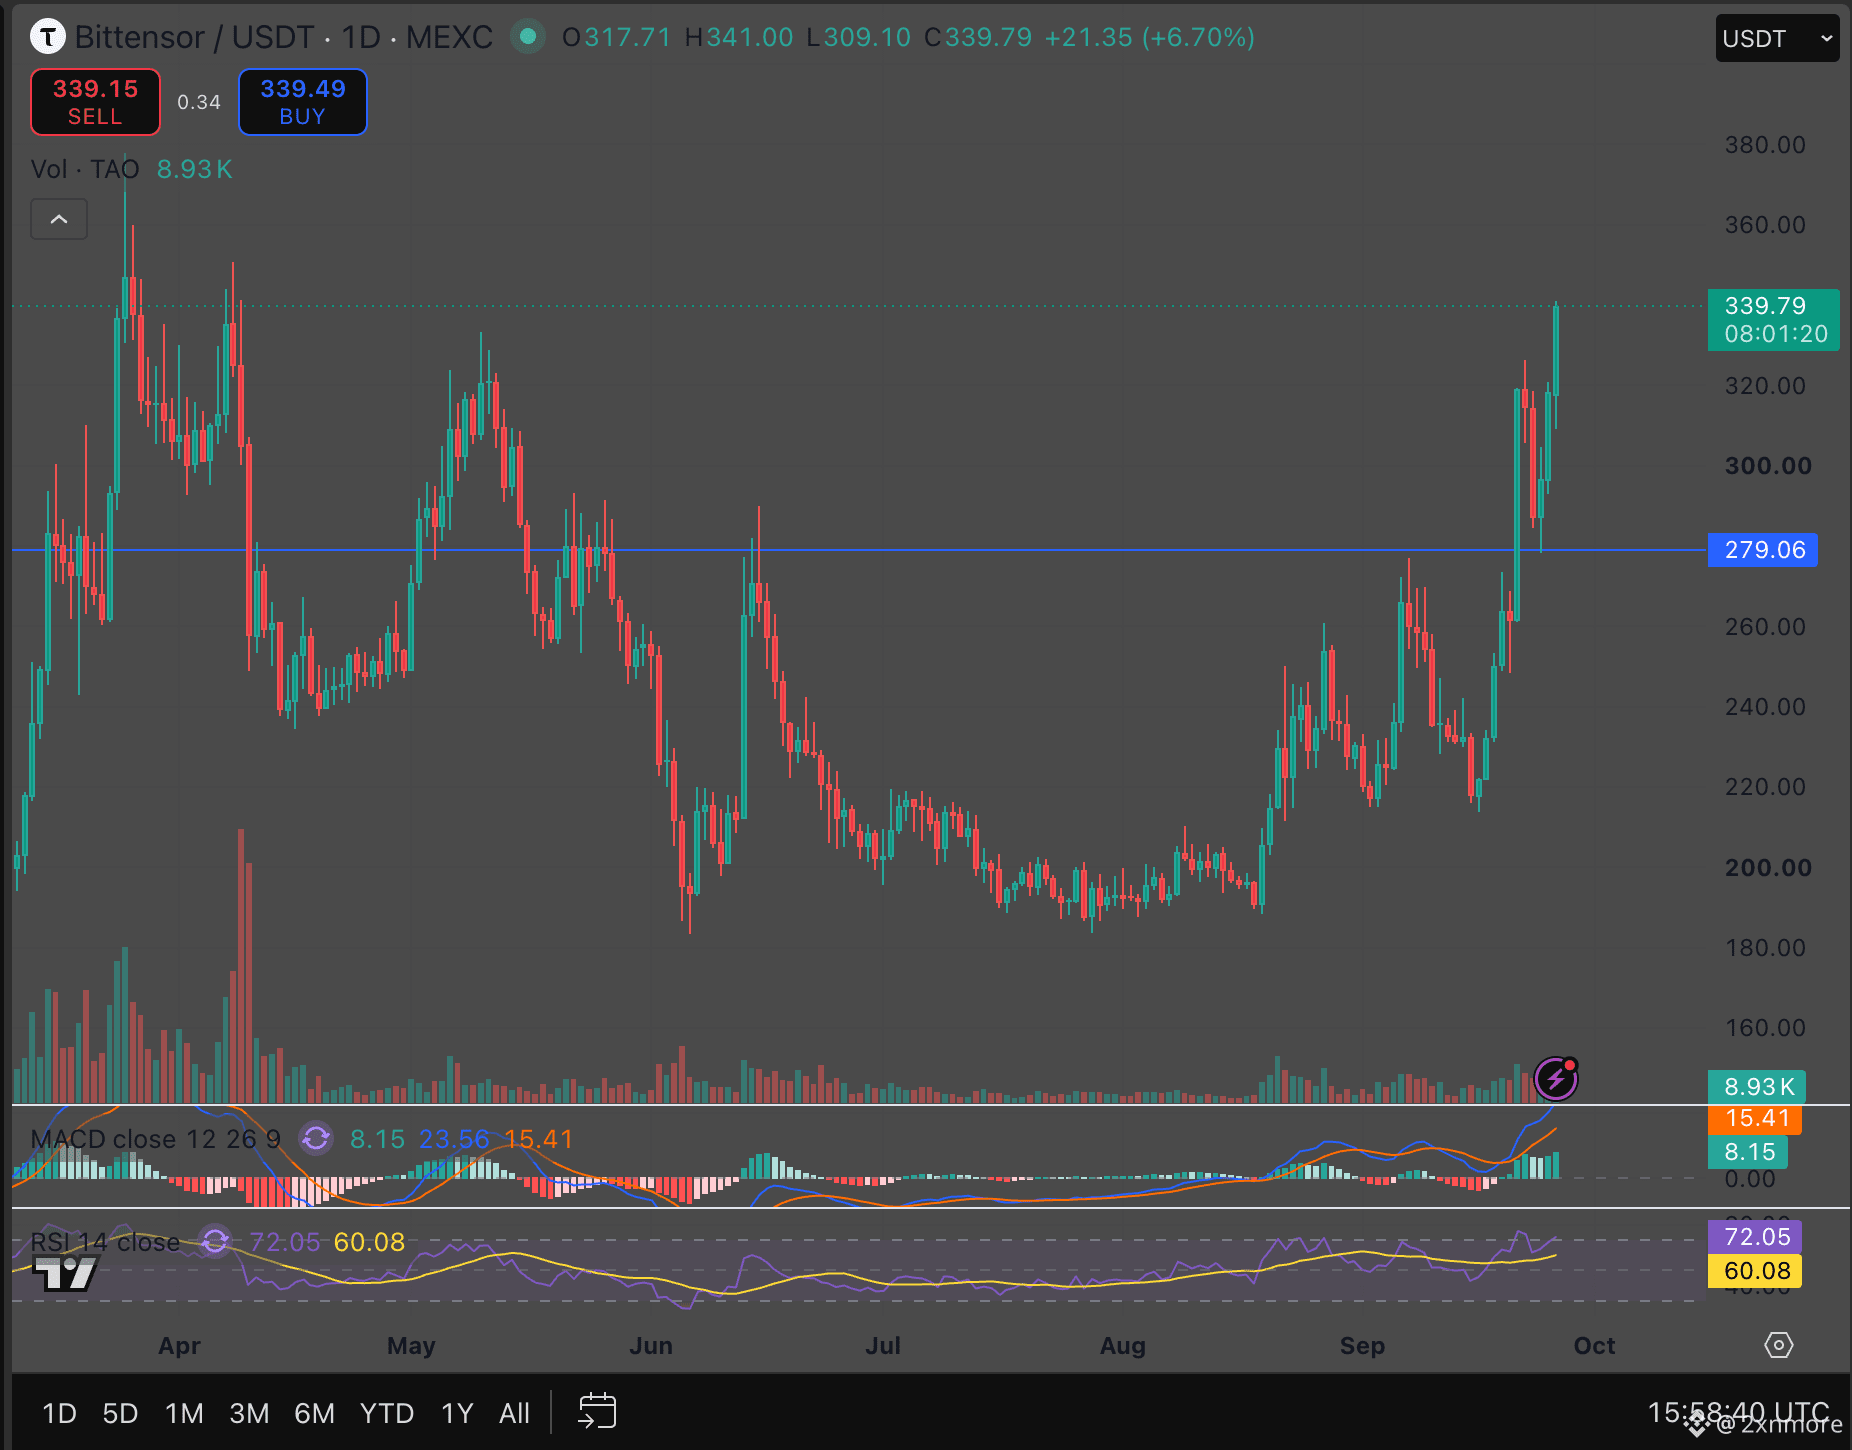
Everyone who sold
$TAO
at $200 is watching it clear $335 right now, and the hardest part has not even started.
Daily high:
$341
Weekly candle:
+29%
But a level is not broken until the candle closes, and this is where most people get it wrong.
Resistance being tested:
$335
A daily close above it breaks the lower high pattern
$TAO
has been stuck in since March.
The weekly close in the next day and a half matters even more.
Next resistance:
$370
That is the April high, the last major supply zone before the chart opens up.
Support to defend:
$279
That line capped price for months, and this week it flipped. Price broke above it, pulled back to tag it, and bounced.
Invalidation:
Weekly close below $279
Now the part the daily chart is hiding.
The weekly MACD just crossed up and turned positive, while weekly RSI sits at 62 with plenty of room to run.
The daily is running hot. RSI is at 72, which is overbought, so a pullback toward $300 would be healthy, not bearish.
Volume is improving but is still nowhere near the April run, so I want to see expansion on any push toward $370.
The breakout was the easy part to see. Holding $279 on the pullback is what separates a trend from a trap.
$TAO
at $200 is watching it clear $335 right now, and the hardest part has not even started.
Daily high:
$341
Weekly candle:
+29%
But a level is not broken until the candle closes, and this is where most people get it wrong.
Resistance being tested:
$335
A daily close above it breaks the lower high pattern
$TAO
has been stuck in since March.
The weekly close in the next day and a half matters even more.
Next resistance:
$370
That is the April high, the last major supply zone before the chart opens up.
Support to defend:
$279
That line capped price for months, and this week it flipped. Price broke above it, pulled back to tag it, and bounced.
Invalidation:
Weekly close below $279
Now the part the daily chart is hiding.
The weekly MACD just crossed up and turned positive, while weekly RSI sits at 62 with plenty of room to run.
The daily is running hot. RSI is at 72, which is overbought, so a pullback toward $300 would be healthy, not bearish.
Volume is improving but is still nowhere near the April run, so I want to see expansion on any push toward $370.
The breakout was the easy part to see. Holding $279 on the pullback is what separates a trend from a trap.