$ZEC
⚡️Looks like continuation! Look at the Staircase This Chart Has Built
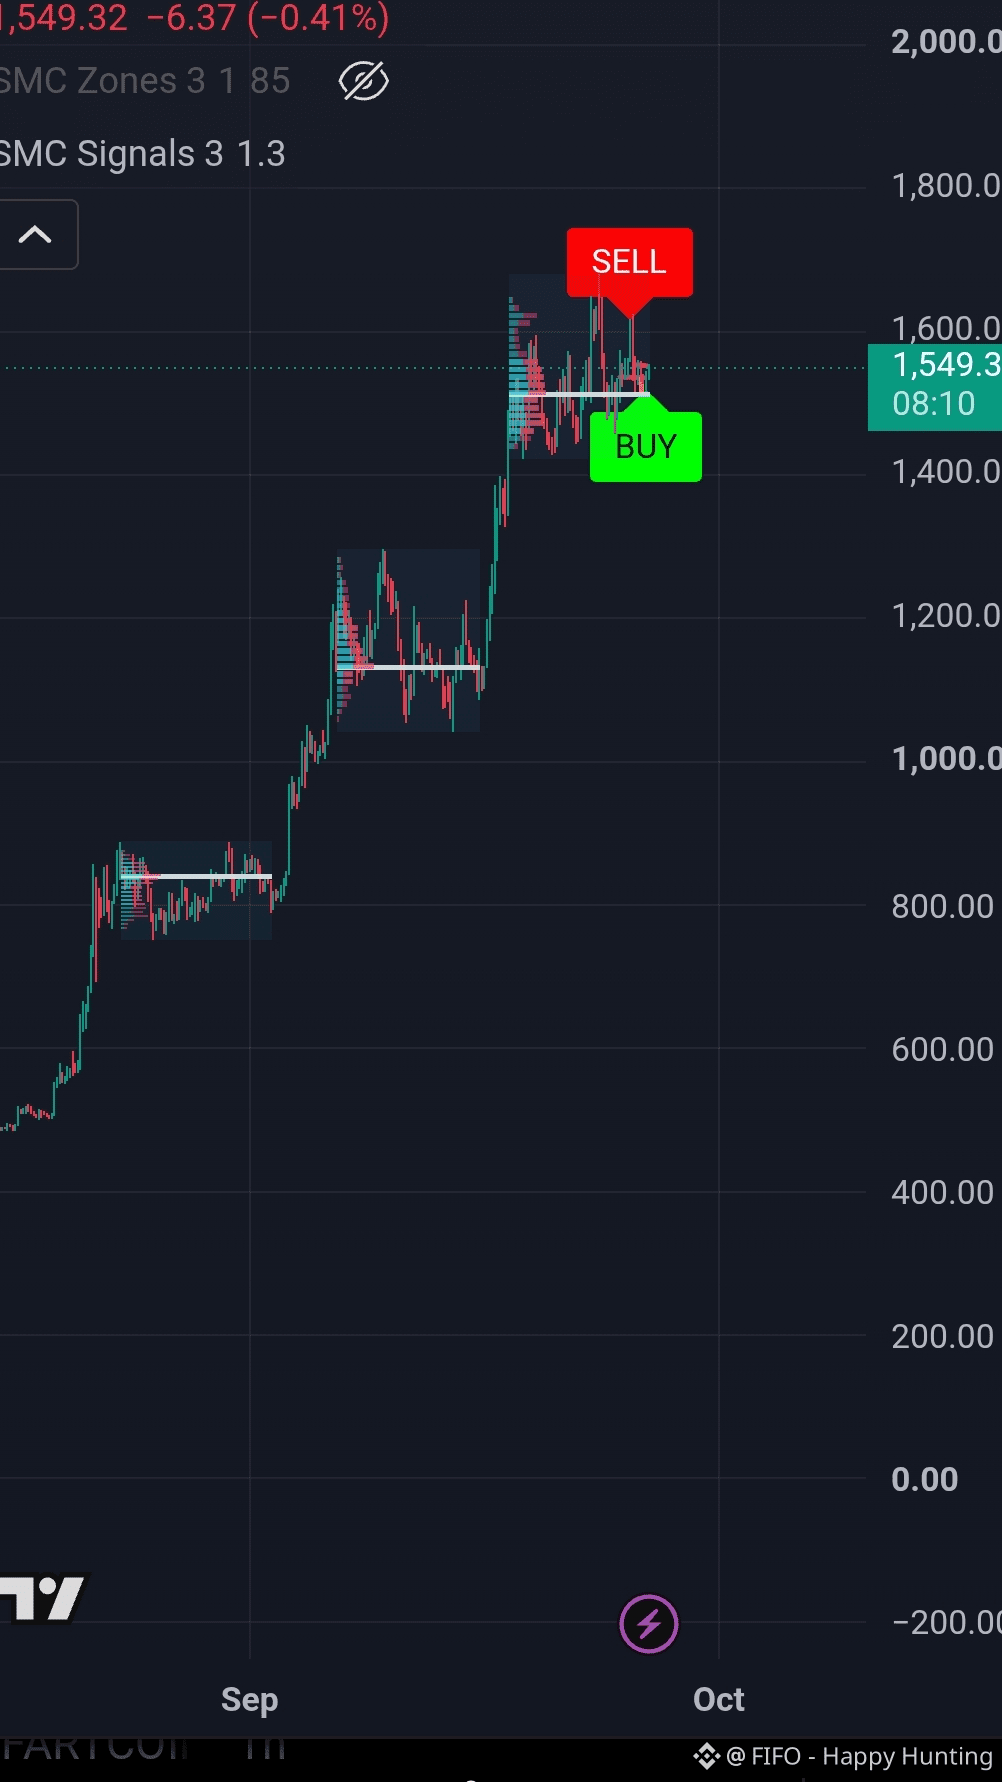
ZEC is at $1,549.59, and zooming out on the 4h tells a bigger story than any single pullback — three distinct legs, each starting from a tight consolidation and breaking into a sharp move higher, stepping from the $800s to $1,100s to now $1,400–1,600.
That's a real structural pattern, not just noise. One read: if this repeats, one more impulsive leg could be coming before real exhaustion sets in — each leg has been getting bigger, and moves like that don't accelerate forever.
Worth being clear this isn't the only way it plays out. The pattern could just continue stair-stepping higher without a major correction anytime soon, or this current zone could be where it breaks down instead of up.
Bull case: pattern suggests one more leg is still on the table before real weakness shows up.
Risk case: accelerating moves like this often mark the later stage of a trend, not the middle of it.
Do you think this staircase has one more step left, or is this the top of it?
Not financial advice — structure and scenarios, not a signal. DYOR.
Happy Hunting!
Like and follow for more.
⚡️Looks like continuation! Look at the Staircase This Chart Has Built
ZEC is at $1,549.59, and zooming out on the 4h tells a bigger story than any single pullback — three distinct legs, each starting from a tight consolidation and breaking into a sharp move higher, stepping from the $800s to $1,100s to now $1,400–1,600.
That's a real structural pattern, not just noise. One read: if this repeats, one more impulsive leg could be coming before real exhaustion sets in — each leg has been getting bigger, and moves like that don't accelerate forever.
Worth being clear this isn't the only way it plays out. The pattern could just continue stair-stepping higher without a major correction anytime soon, or this current zone could be where it breaks down instead of up.
Bull case: pattern suggests one more leg is still on the table before real weakness shows up.
Risk case: accelerating moves like this often mark the later stage of a trend, not the middle of it.
Do you think this staircase has one more step left, or is this the top of it?
Not financial advice — structure and scenarios, not a signal. DYOR.
Happy Hunting!
Like and follow for more.