HOW I TESTED IT
I sorted every funding print into quintiles and measured the forward 72-hour return of the highest versus the lowest.
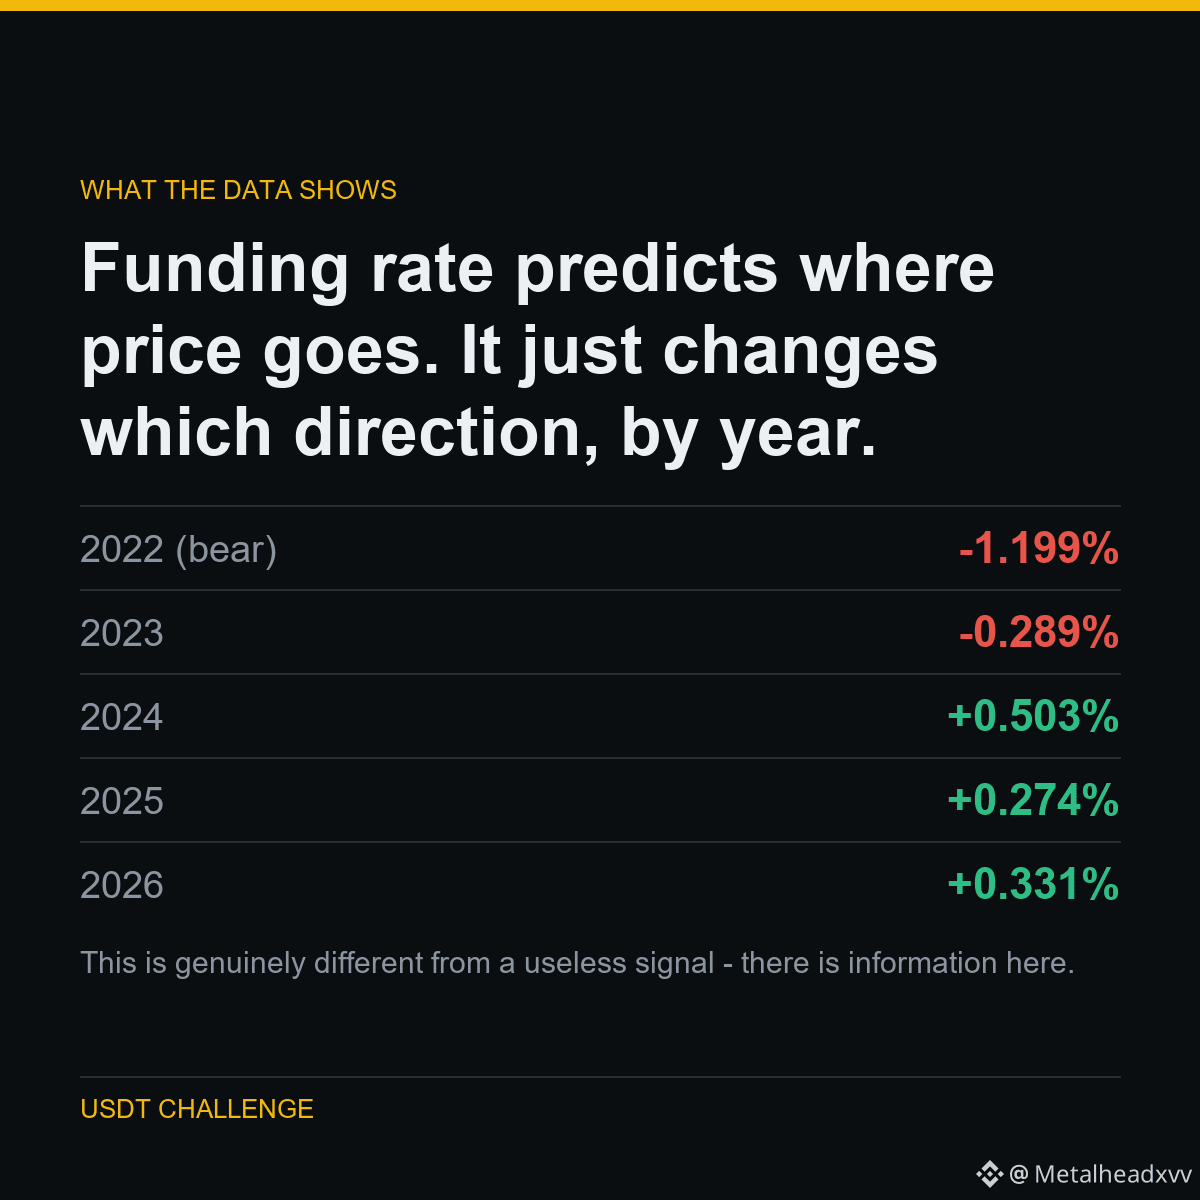
In bear markets, high funding preceded WORSE returns - crowded longs getting squeezed. From 2024 onward it preceded BETTER returns - momentum.
The signal is real. The sign is not stable. Average it across all years and you get -0.08%, below the 0.240% it costs to trade.
THE NUMBERS
2022 (bear): -1.199%
2023: -0.289%
2024: +0.503%
2025: +0.274%
2026: +0.331%
This is genuinely different from a useless signal - there is information here. But to use it you would need to know the regime in advance, which is the same circular problem that kills everything else.
Part of a public experiment: 5,063 USDT to 1,000,000 USDT, every result published - including the ones that make me look bad.
Run on $BTC $ETH $DOGE
#Binance #Futures #Backtesting #TradingBot #CryptoData
I sorted every funding print into quintiles and measured the forward 72-hour return of the highest versus the lowest.
In bear markets, high funding preceded WORSE returns - crowded longs getting squeezed. From 2024 onward it preceded BETTER returns - momentum.
The signal is real. The sign is not stable. Average it across all years and you get -0.08%, below the 0.240% it costs to trade.
THE NUMBERS
2022 (bear): -1.199%
2023: -0.289%
2024: +0.503%
2025: +0.274%
2026: +0.331%
This is genuinely different from a useless signal - there is information here. But to use it you would need to know the regime in advance, which is the same circular problem that kills everything else.
Part of a public experiment: 5,063 USDT to 1,000,000 USDT, every result published - including the ones that make me look bad.
Run on $BTC $ETH $DOGE
#Binance #Futures #Backtesting #TradingBot #CryptoData