Breakout or Liquidity Sweep?
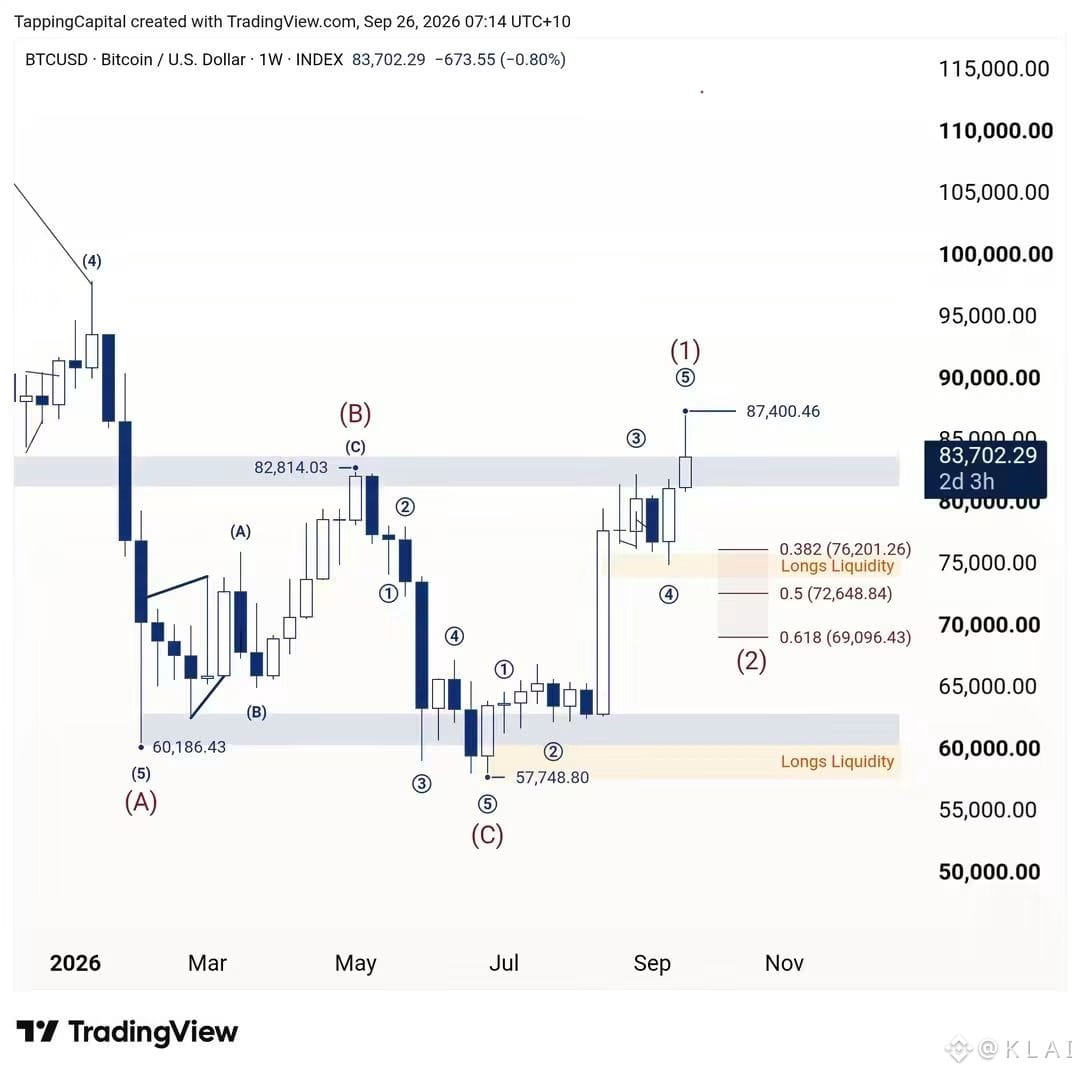
Bitcoin rallied to $87,400, clearing its previous high near $82,800. But the real question is whether buyers can actually hold above it.
Monday's weekly close is key.
The weekly candle closes Monday morning. If Bitcoin closes back below $82,800, it will print a long upper wick a sign price likely swept liquidity by taking out stops above the old high before reversing. A strong close above that zone would suggest a more genuine breakout.
The pullback is still unfolding.
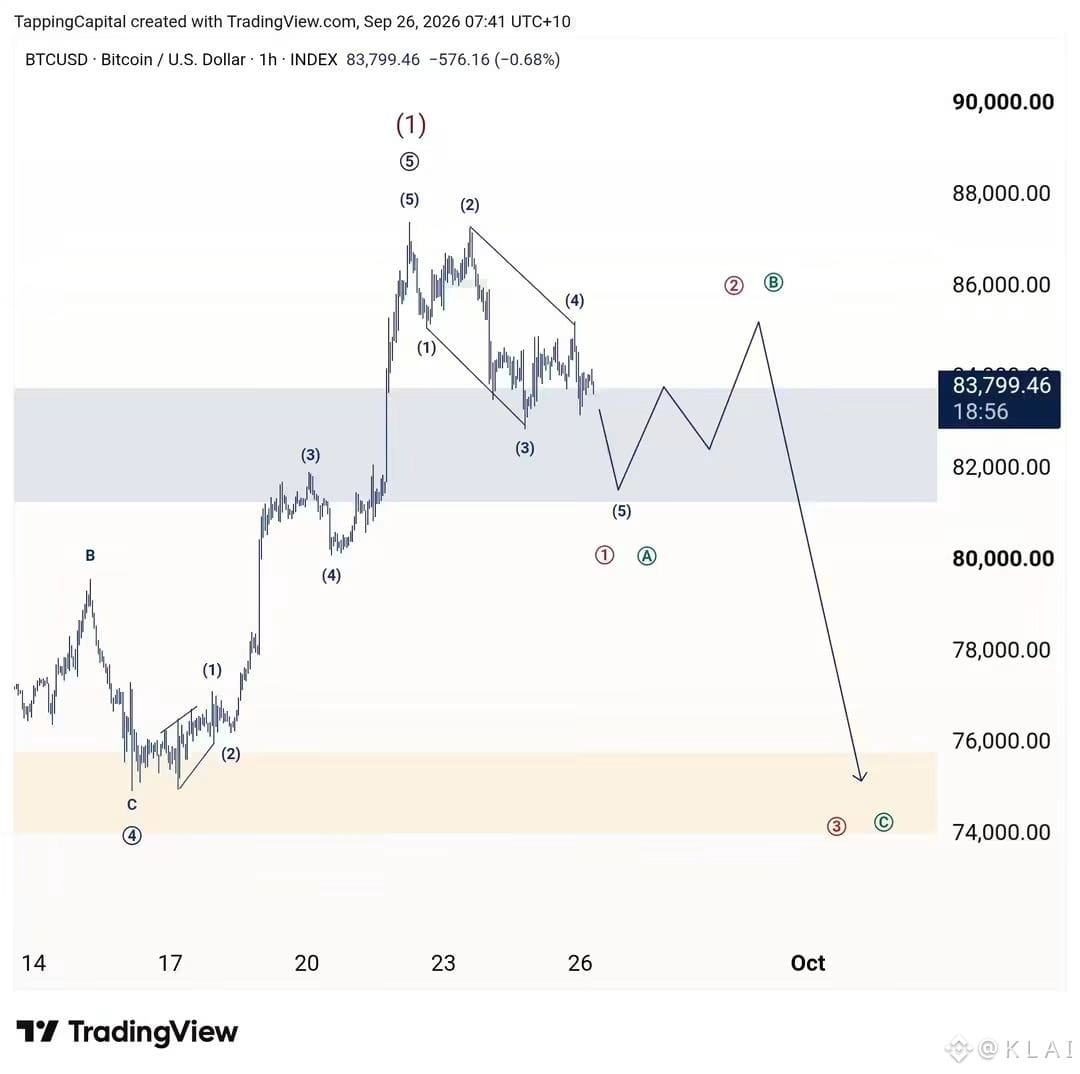
On the hourly chart, the decline from $87,400 looks like a five-wave move, with Wave 5 still to complete. Once it's finished, I expect a bounce (either Wave 2 or Wave B) that forms a lower high, followed by another leg down.
$74k–$75k is the magnet.
That zone holds a large pool of long liquidity and aligns with the 0.382 Fibonacci retracement at $76,201. If selling deepens, $72,649 (0.5) and $69,096 (0.618) are next in focus.
For now, it's about following structure not assuming direction. Elliott Wave gives probabilities, not certainties.
$SENT $RUNE
Bitcoin rallied to $87,400, clearing its previous high near $82,800. But the real question is whether buyers can actually hold above it.
Monday's weekly close is key.
The weekly candle closes Monday morning. If Bitcoin closes back below $82,800, it will print a long upper wick a sign price likely swept liquidity by taking out stops above the old high before reversing. A strong close above that zone would suggest a more genuine breakout.
The pullback is still unfolding.
On the hourly chart, the decline from $87,400 looks like a five-wave move, with Wave 5 still to complete. Once it's finished, I expect a bounce (either Wave 2 or Wave B) that forms a lower high, followed by another leg down.
$74k–$75k is the magnet.
That zone holds a large pool of long liquidity and aligns with the 0.382 Fibonacci retracement at $76,201. If selling deepens, $72,649 (0.5) and $69,096 (0.618) are next in focus.
For now, it's about following structure not assuming direction. Elliott Wave gives probabilities, not certainties.
$SENT $RUNE