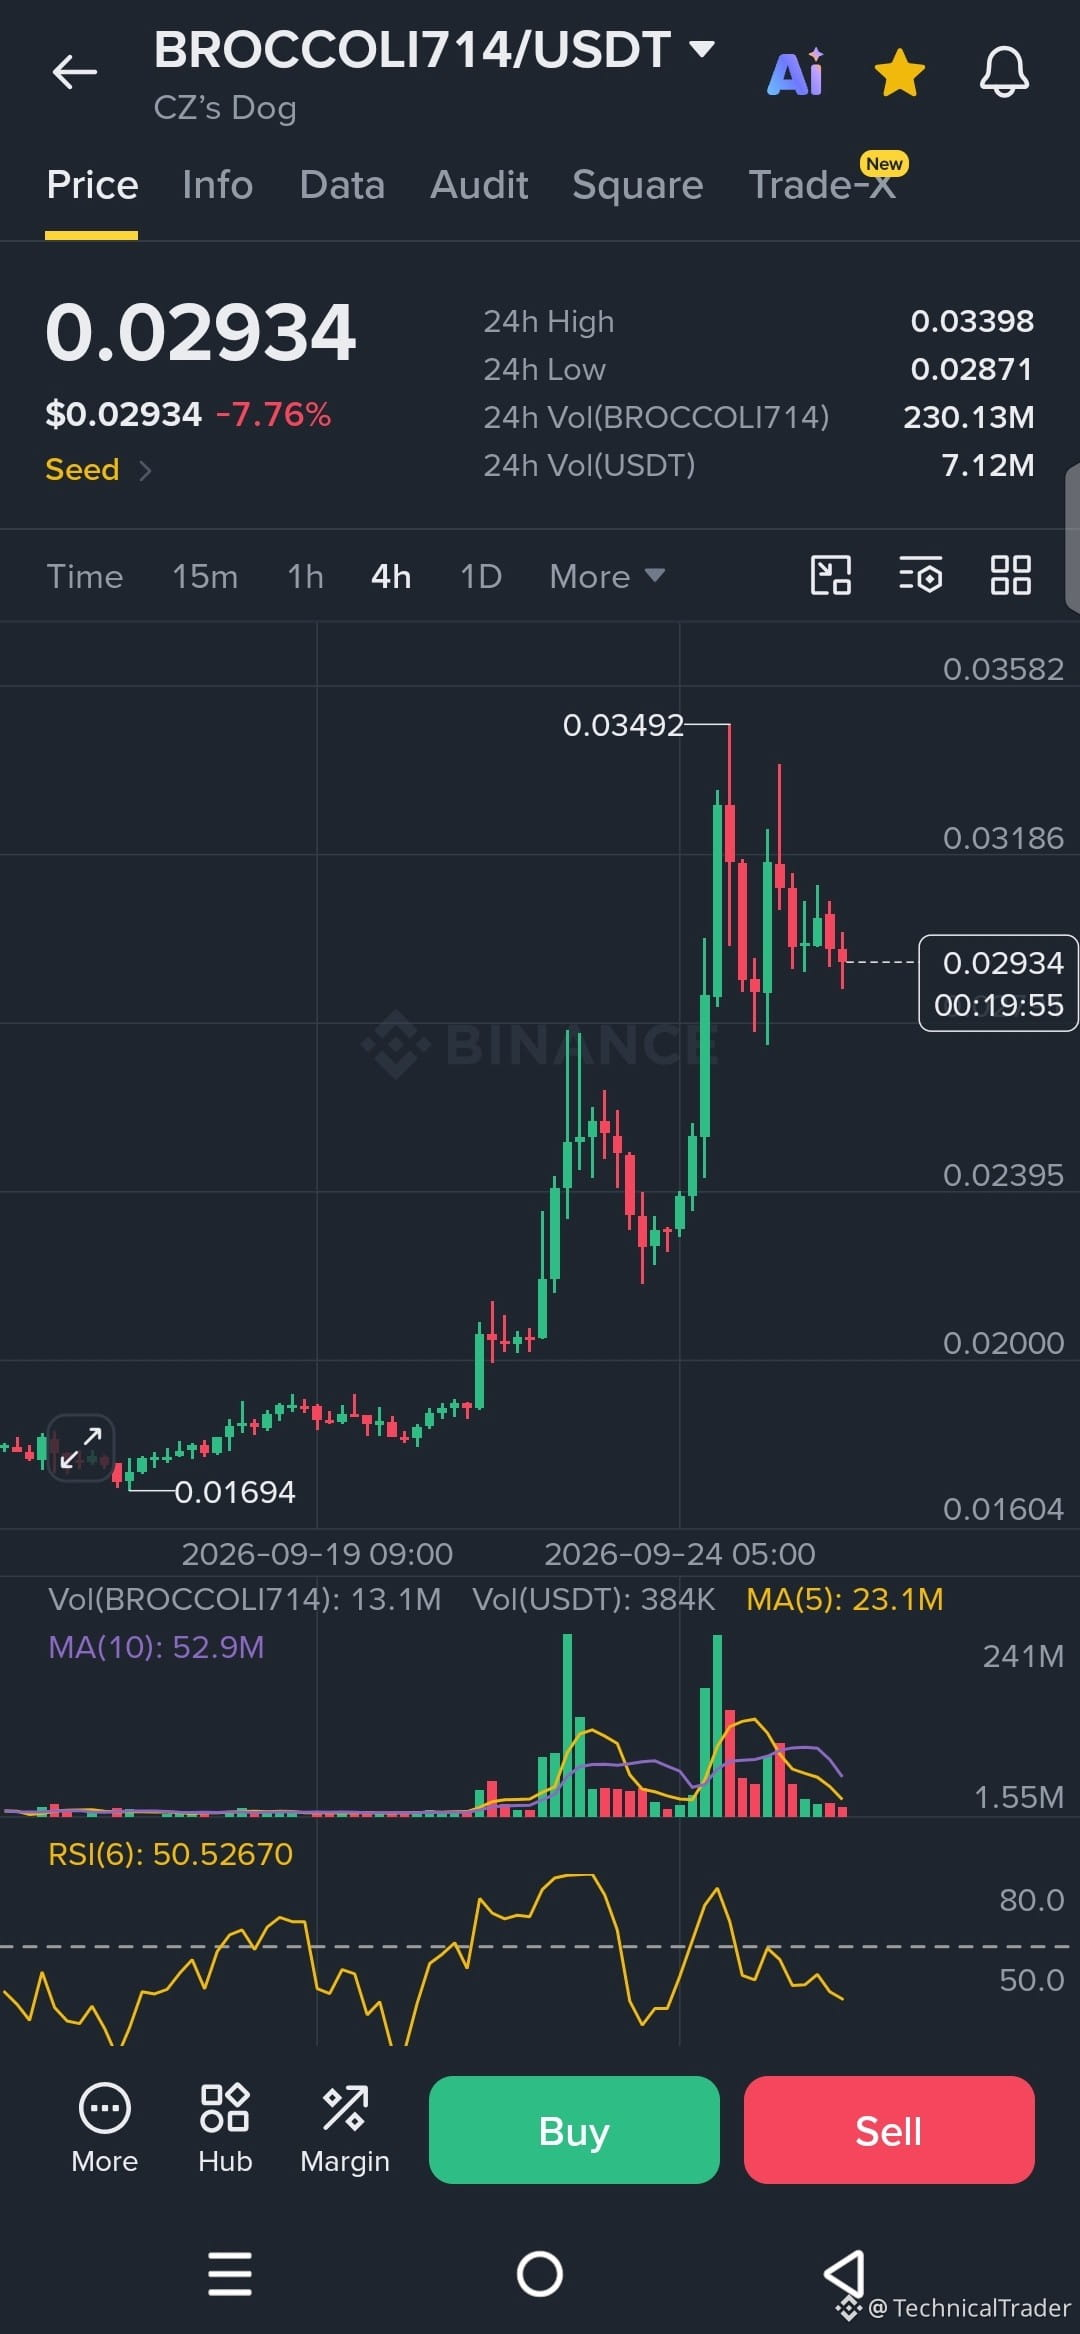
Guys, $BROCCOLI714 made a sharp move from around 0.024 all the way to 0.03492, but look at what happened after that spike. Price was rejected near the top and has started making lower highs on the 4H chart.
Right now, price is around 0.02934, sitting below the 0.03186 area. This is the level I’m watching closely. If price reclaims 0.03186 with strong candles, we could see another attempt toward 0.03492 🔥
On the other side, 0.02871 is important because it matches the visible 24H low and sits close to the recent consolidation. A breakdown below this area could put pressure on price and bring the 0.02395 region back into focus 📉
Volume is also worth watching. The biggest volume came during the major price expansion, while volume has been decreasing during the recent pullback. RSI is around 50, so momentum has cooled significantly from the earlier spike.
For the bullish scenario, I’m watching 0.03186 first. A strong move above it could bring 0.03492 back into play. For the bearish scenario, losing 0.02871 would weaken the current structure and make the lower support around 0.02395 important.
There is a clear reaction zone around the recent highs, but an exact FVG or order block cannot be confirmed from this screenshot, so I wouldn’t force one into the analysis.
The next thing I’m watching is simple: 0.03186 on the upside and 0.02871 on the downside. A clean break of either level would give the chart a clearer direction. 👀📈📉
Guys, follow for more chart analysis 😎 I’ll keep showing you exactly what the chart is telling us. 👀🔥
Right now, price is around 0.02934, sitting below the 0.03186 area. This is the level I’m watching closely. If price reclaims 0.03186 with strong candles, we could see another attempt toward 0.03492 🔥
On the other side, 0.02871 is important because it matches the visible 24H low and sits close to the recent consolidation. A breakdown below this area could put pressure on price and bring the 0.02395 region back into focus 📉
Volume is also worth watching. The biggest volume came during the major price expansion, while volume has been decreasing during the recent pullback. RSI is around 50, so momentum has cooled significantly from the earlier spike.
For the bullish scenario, I’m watching 0.03186 first. A strong move above it could bring 0.03492 back into play. For the bearish scenario, losing 0.02871 would weaken the current structure and make the lower support around 0.02395 important.
There is a clear reaction zone around the recent highs, but an exact FVG or order block cannot be confirmed from this screenshot, so I wouldn’t force one into the analysis.
The next thing I’m watching is simple: 0.03186 on the upside and 0.02871 on the downside. A clean break of either level would give the chart a clearer direction. 👀📈📉
Guys, follow for more chart analysis 😎 I’ll keep showing you exactly what the chart is telling us. 👀🔥