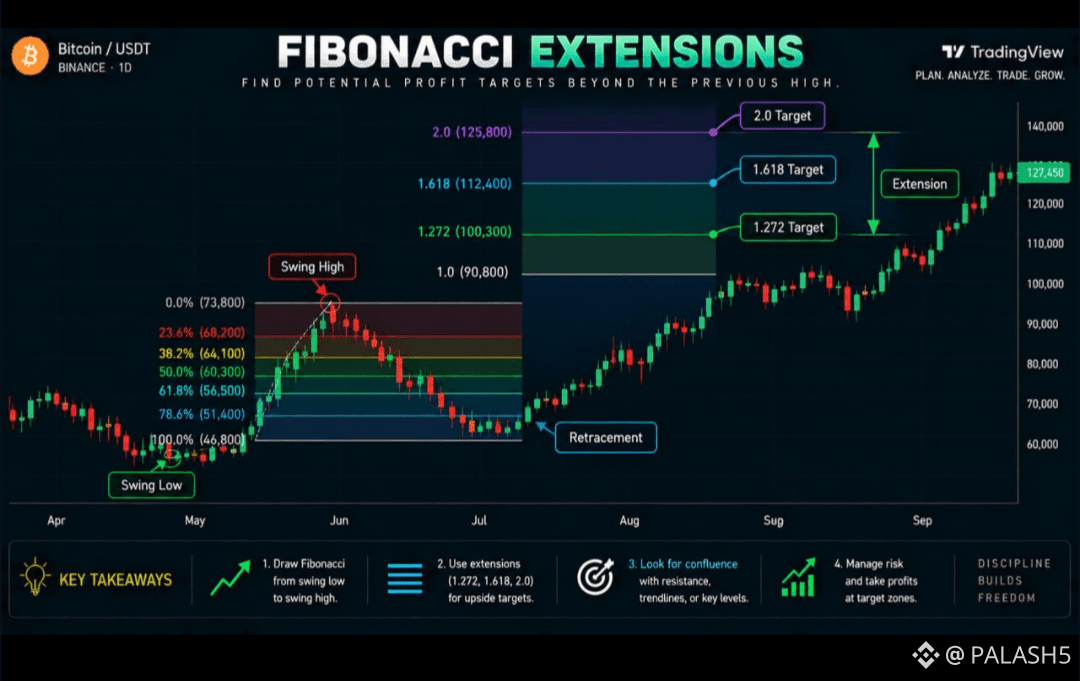
Fibonacci Extensions
Fibonacci isn't only useful for finding pullback zones.
It can also help traders estimate where price could potentially go next after a breakout.
That's where Fibonacci Extensions come in.
🔹 Retracement vs Extension
The difference is simple:
• Retracement → Helps identify potential areas where price may pull back.
• Extension → Helps identify potential areas where price may continue beyond the previous high or low.
For example:
BTC rallies from $80K → $100K, then pulls back to $92K.
If price starts moving higher again, Fibonacci Extensions can help traders identify potential profit-taking or target zones above $100K.
🎯 Common Extension Levels
Traders commonly watch:
▪️ 127.2%
▪️ 161.8%
▪️ 200%
▪️ 261.8%
These levels can act as potential areas where price may slow down, consolidate, or face profit-taking.
But don't think:
❌ “BTC reached 161.8%, so it must reverse.”
That's not how it works.
🔥 Use Extensions With Structure
Fibonacci Extensions become more useful when they align with market structure and other technical factors.
For example:
BTC breaks a major resistance → creates a Higher High → continues upward.
If the 161.8% extension also lines up with an old resistance zone, that area may become a more interesting potential target.
Look for confluence with:
▪️ Support & resistance
▪️ HH/HL or LH/LL structure
▪️ Volume
▪️ Price action
▪️ Previous swing levels
Remember:
•Retracement helps you find potential pullbacks.
•Extension helps you plan potential targets.
Neither guarantees what price will do.
Don't use Fibonacci to predict the future. Use it to build a plan around potential scenarios. 🚀
Fibonacci isn't only useful for finding pullback zones.
It can also help traders estimate where price could potentially go next after a breakout.
That's where Fibonacci Extensions come in.
🔹 Retracement vs Extension
The difference is simple:
• Retracement → Helps identify potential areas where price may pull back.
• Extension → Helps identify potential areas where price may continue beyond the previous high or low.
For example:
BTC rallies from $80K → $100K, then pulls back to $92K.
If price starts moving higher again, Fibonacci Extensions can help traders identify potential profit-taking or target zones above $100K.
🎯 Common Extension Levels
Traders commonly watch:
▪️ 127.2%
▪️ 161.8%
▪️ 200%
▪️ 261.8%
These levels can act as potential areas where price may slow down, consolidate, or face profit-taking.
But don't think:
❌ “BTC reached 161.8%, so it must reverse.”
That's not how it works.
🔥 Use Extensions With Structure
Fibonacci Extensions become more useful when they align with market structure and other technical factors.
For example:
BTC breaks a major resistance → creates a Higher High → continues upward.
If the 161.8% extension also lines up with an old resistance zone, that area may become a more interesting potential target.
Look for confluence with:
▪️ Support & resistance
▪️ HH/HL or LH/LL structure
▪️ Volume
▪️ Price action
▪️ Previous swing levels
Remember:
•Retracement helps you find potential pullbacks.
•Extension helps you plan potential targets.
Neither guarantees what price will do.
Don't use Fibonacci to predict the future. Use it to build a plan around potential scenarios. 🚀