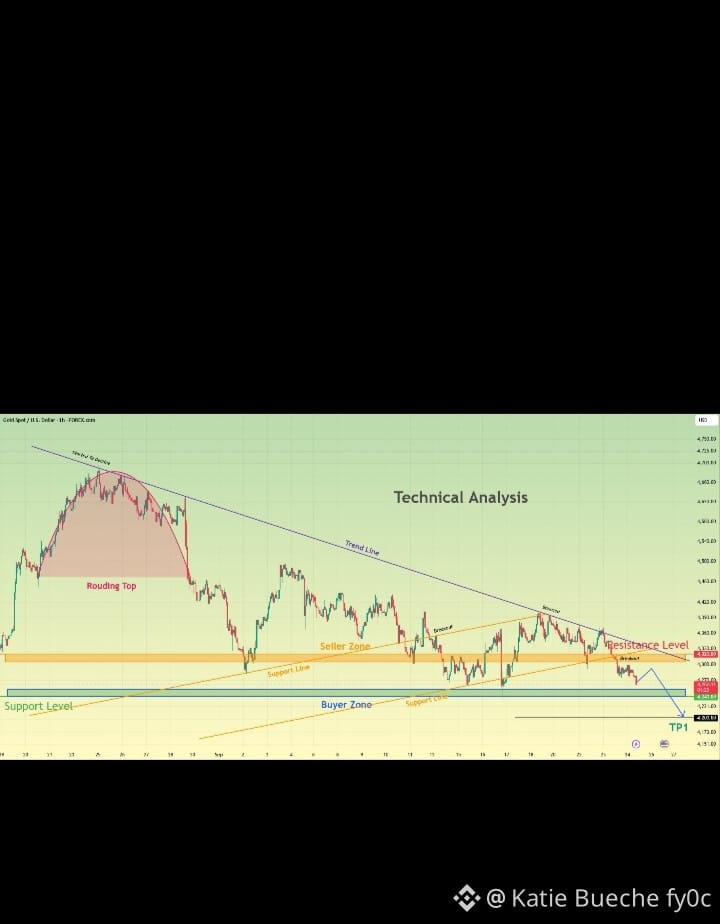
Gold is currently showing a clear technical structure on the chart.
After forming a Rounding Top, price experienced a strong bearish move and started trading below the major descending trend line.
Since then, price has been moving inside a broader consolidation area between the resistance zone and the buyer/support zone.
🔴 Key Resistance
The upper area is acting as a Resistance Level, with the descending trend line adding further pressure from above.
Price has tested this area several times but has not established a strong breakout above the trend line.
🟠 Seller Zone
The middle orange area is acting as a Seller Zone. Reactions from this area are important because it has repeatedly acted as a barrier for buyers.
🟢 Support / Buyer Zone
Below the current price, the marked Support Level and Buyer Zone represent an important demand area.
If price reaches this zone, I will watch the reaction carefully rather than assuming an immediate reversal.
📉 Bearish Scenario
If price remains below the resistance area and continues to break lower supports, the next downside area marked on my chart becomes important.
TP1 is the first downside target shown on the chart.
📈 Bullish Scenario
For a bullish continuation, I would want to see price reclaim the resistance area and get a confirmed breakout above the descending trend line.
A simple touch or wick above resistance would not be enough for me. I would wait for confirmation.
🎯 What I’m Watching
• Descending Trend Line
• Resistance Level
• Seller Zone
• Support Level
• Buyer Zone
• Breakout / Rejection
• Market Structure
• TP1
My approach: I don't want to predict the market. I want to wait for price confirmation and then react to what the chart shows.
This is my personal technical analysis for educational purposes, not financial advice. Always do your own research and manage your risk.
#Gold #XAUUSD #GoldAnalysis #TechnicalAnalysis #PriceAction #Trading #Forex #BinanceSquare
After forming a Rounding Top, price experienced a strong bearish move and started trading below the major descending trend line.
Since then, price has been moving inside a broader consolidation area between the resistance zone and the buyer/support zone.
🔴 Key Resistance
The upper area is acting as a Resistance Level, with the descending trend line adding further pressure from above.
Price has tested this area several times but has not established a strong breakout above the trend line.
🟠 Seller Zone
The middle orange area is acting as a Seller Zone. Reactions from this area are important because it has repeatedly acted as a barrier for buyers.
🟢 Support / Buyer Zone
Below the current price, the marked Support Level and Buyer Zone represent an important demand area.
If price reaches this zone, I will watch the reaction carefully rather than assuming an immediate reversal.
📉 Bearish Scenario
If price remains below the resistance area and continues to break lower supports, the next downside area marked on my chart becomes important.
TP1 is the first downside target shown on the chart.
📈 Bullish Scenario
For a bullish continuation, I would want to see price reclaim the resistance area and get a confirmed breakout above the descending trend line.
A simple touch or wick above resistance would not be enough for me. I would wait for confirmation.
🎯 What I’m Watching
• Descending Trend Line
• Resistance Level
• Seller Zone
• Support Level
• Buyer Zone
• Breakout / Rejection
• Market Structure
• TP1
My approach: I don't want to predict the market. I want to wait for price confirmation and then react to what the chart shows.
This is my personal technical analysis for educational purposes, not financial advice. Always do your own research and manage your risk.
#Gold #XAUUSD #GoldAnalysis #TechnicalAnalysis #PriceAction #Trading #Forex #BinanceSquare