SOL long setup: the levels I'm watching
$SOL /USDT - 🟢 Bias: LONG (Strong) · 8/12 signals aligned
Technical verdict: STRONG LONG. 8 of 12 signals aligned, 1 against.
✅ Daily trend: price > EMA50 > EMA200, bullish stack
✅ 4h trend: price > EMA50 > EMA200, bullish stack
✅ 1h trend: price > EMA50 > EMA200, bullish stack
✅ Trend strength (ADX/DI, 15m): ADX 41.2 with buyers in control (DI+ 40.9 vs DI− 4.8)
✅ BTC backdrop: BTC trend is bullish and correlation is 0.84
✅ 4h RSI: 55.2, bullish momentum (above 55)
⚠️ Distance from 1h EMA50: +4.2 ATR from the 1h EMA50, overextended with pullback risk
Trade Plan:
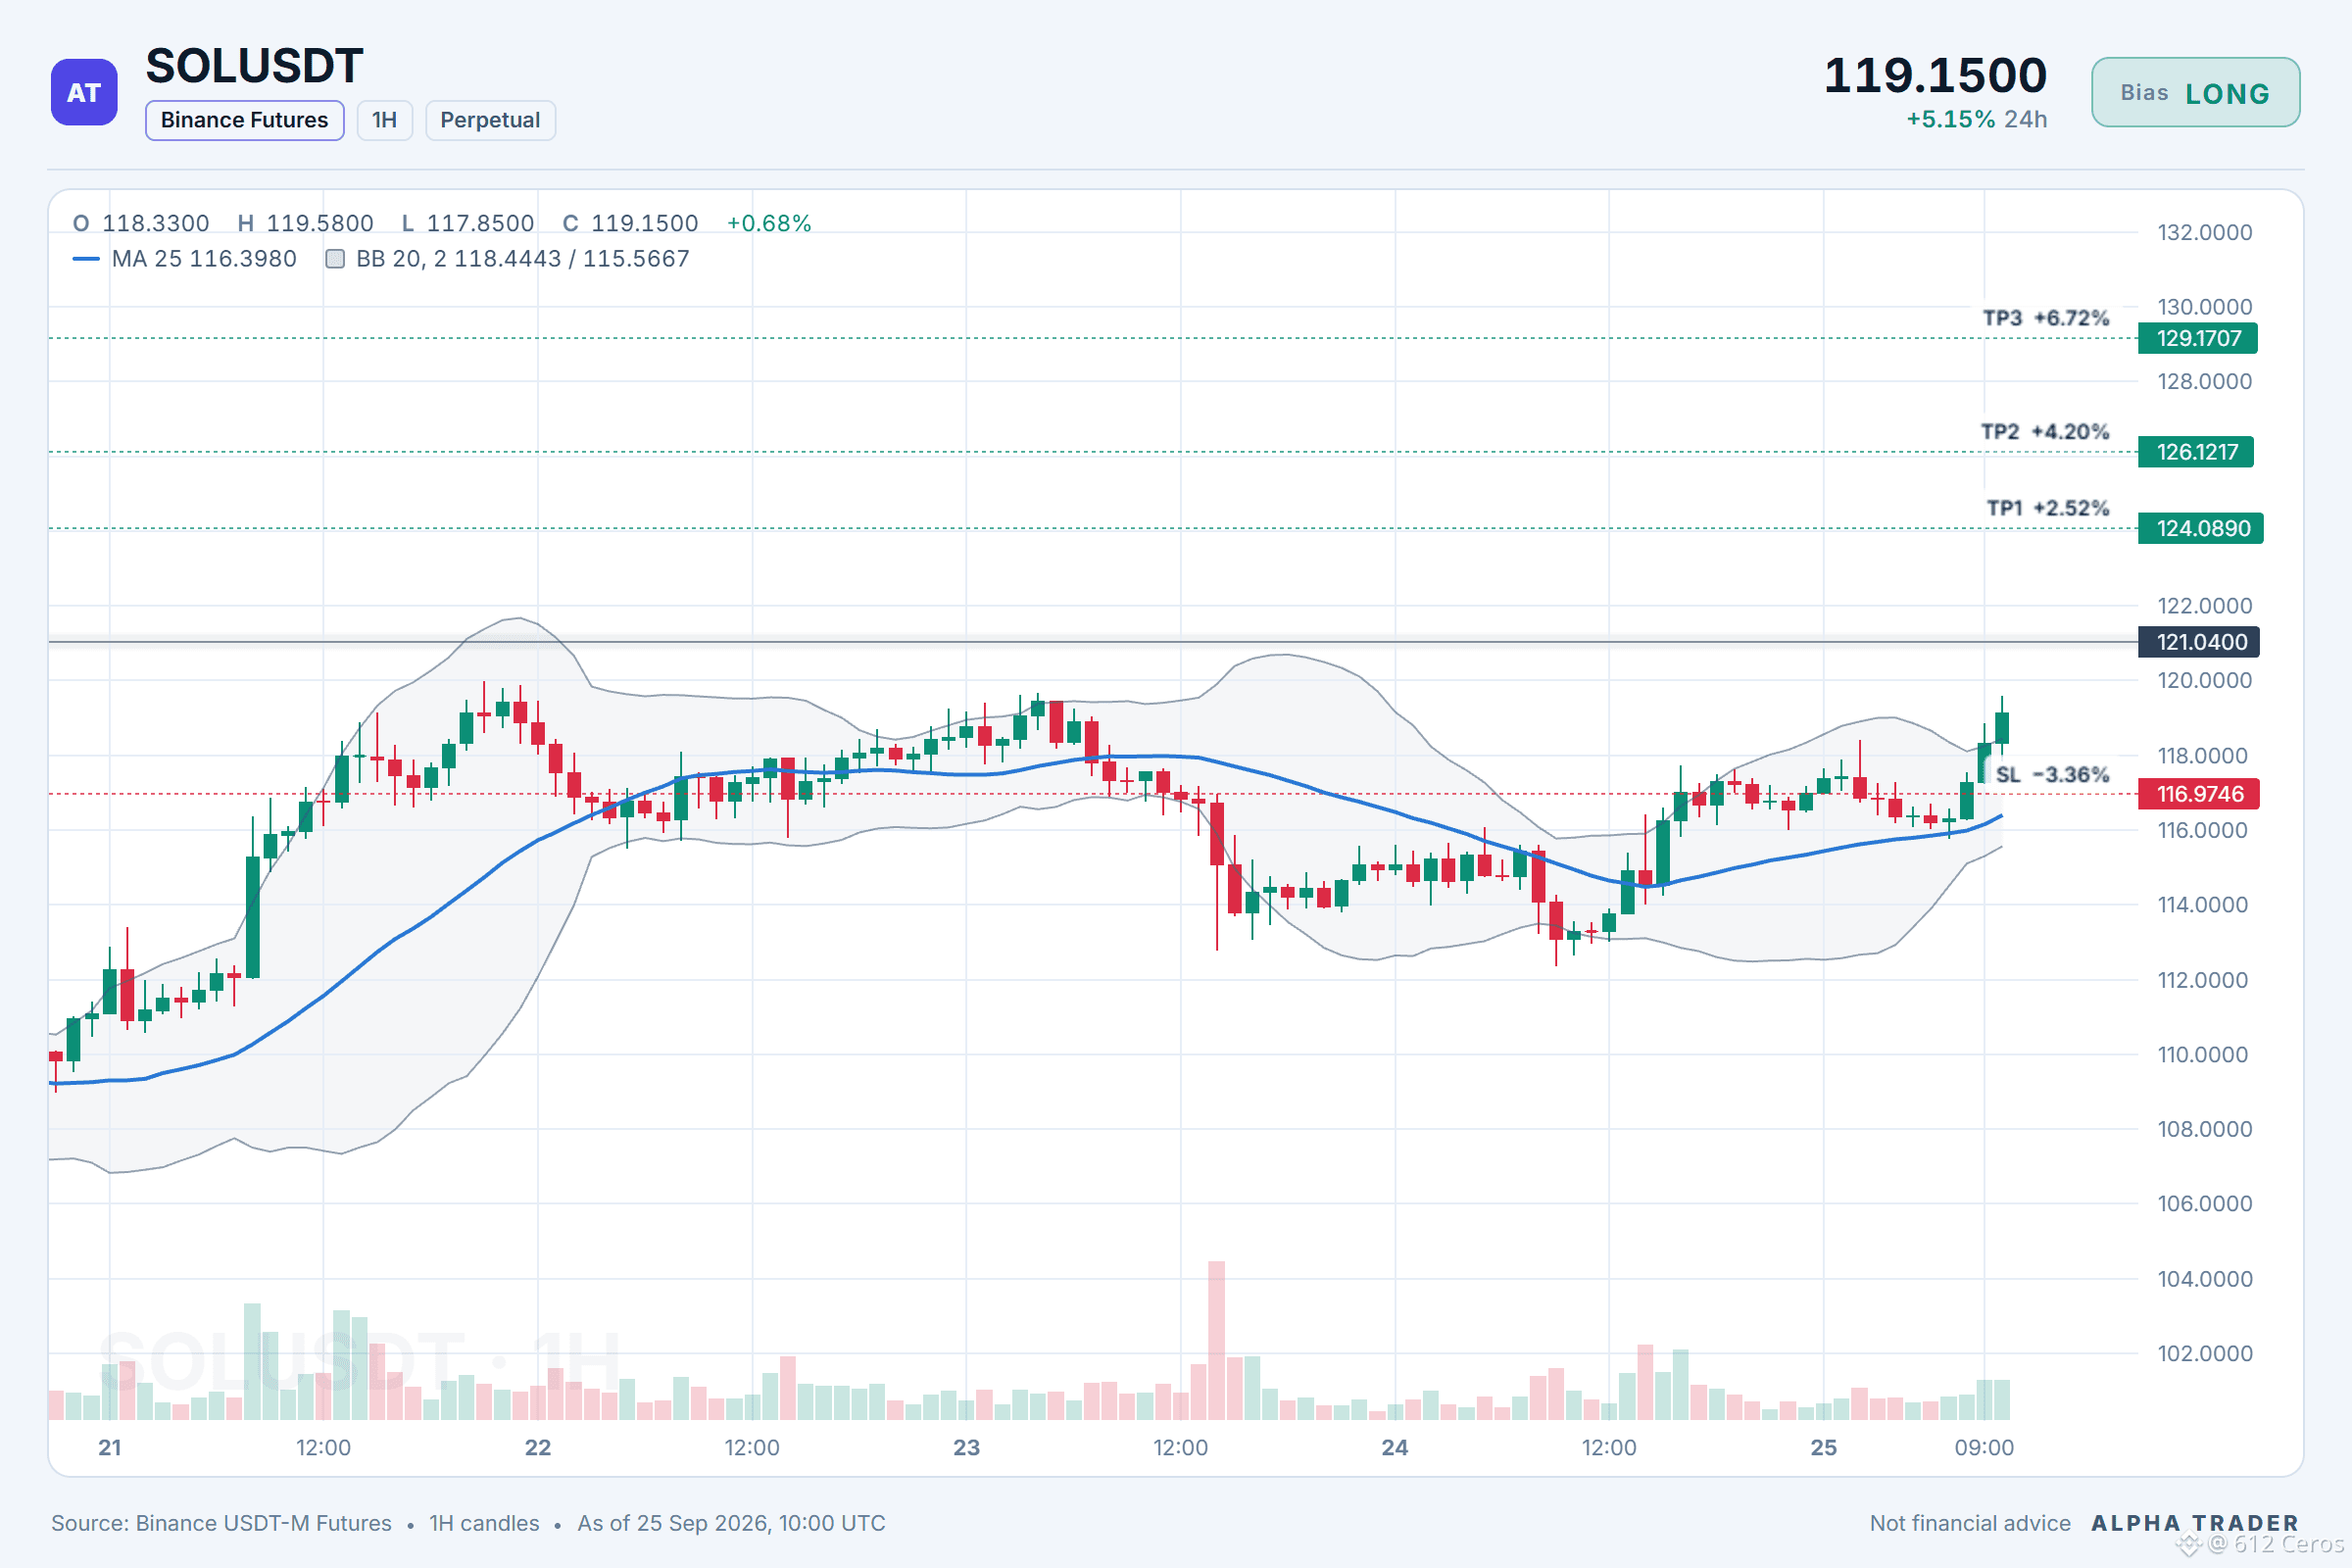
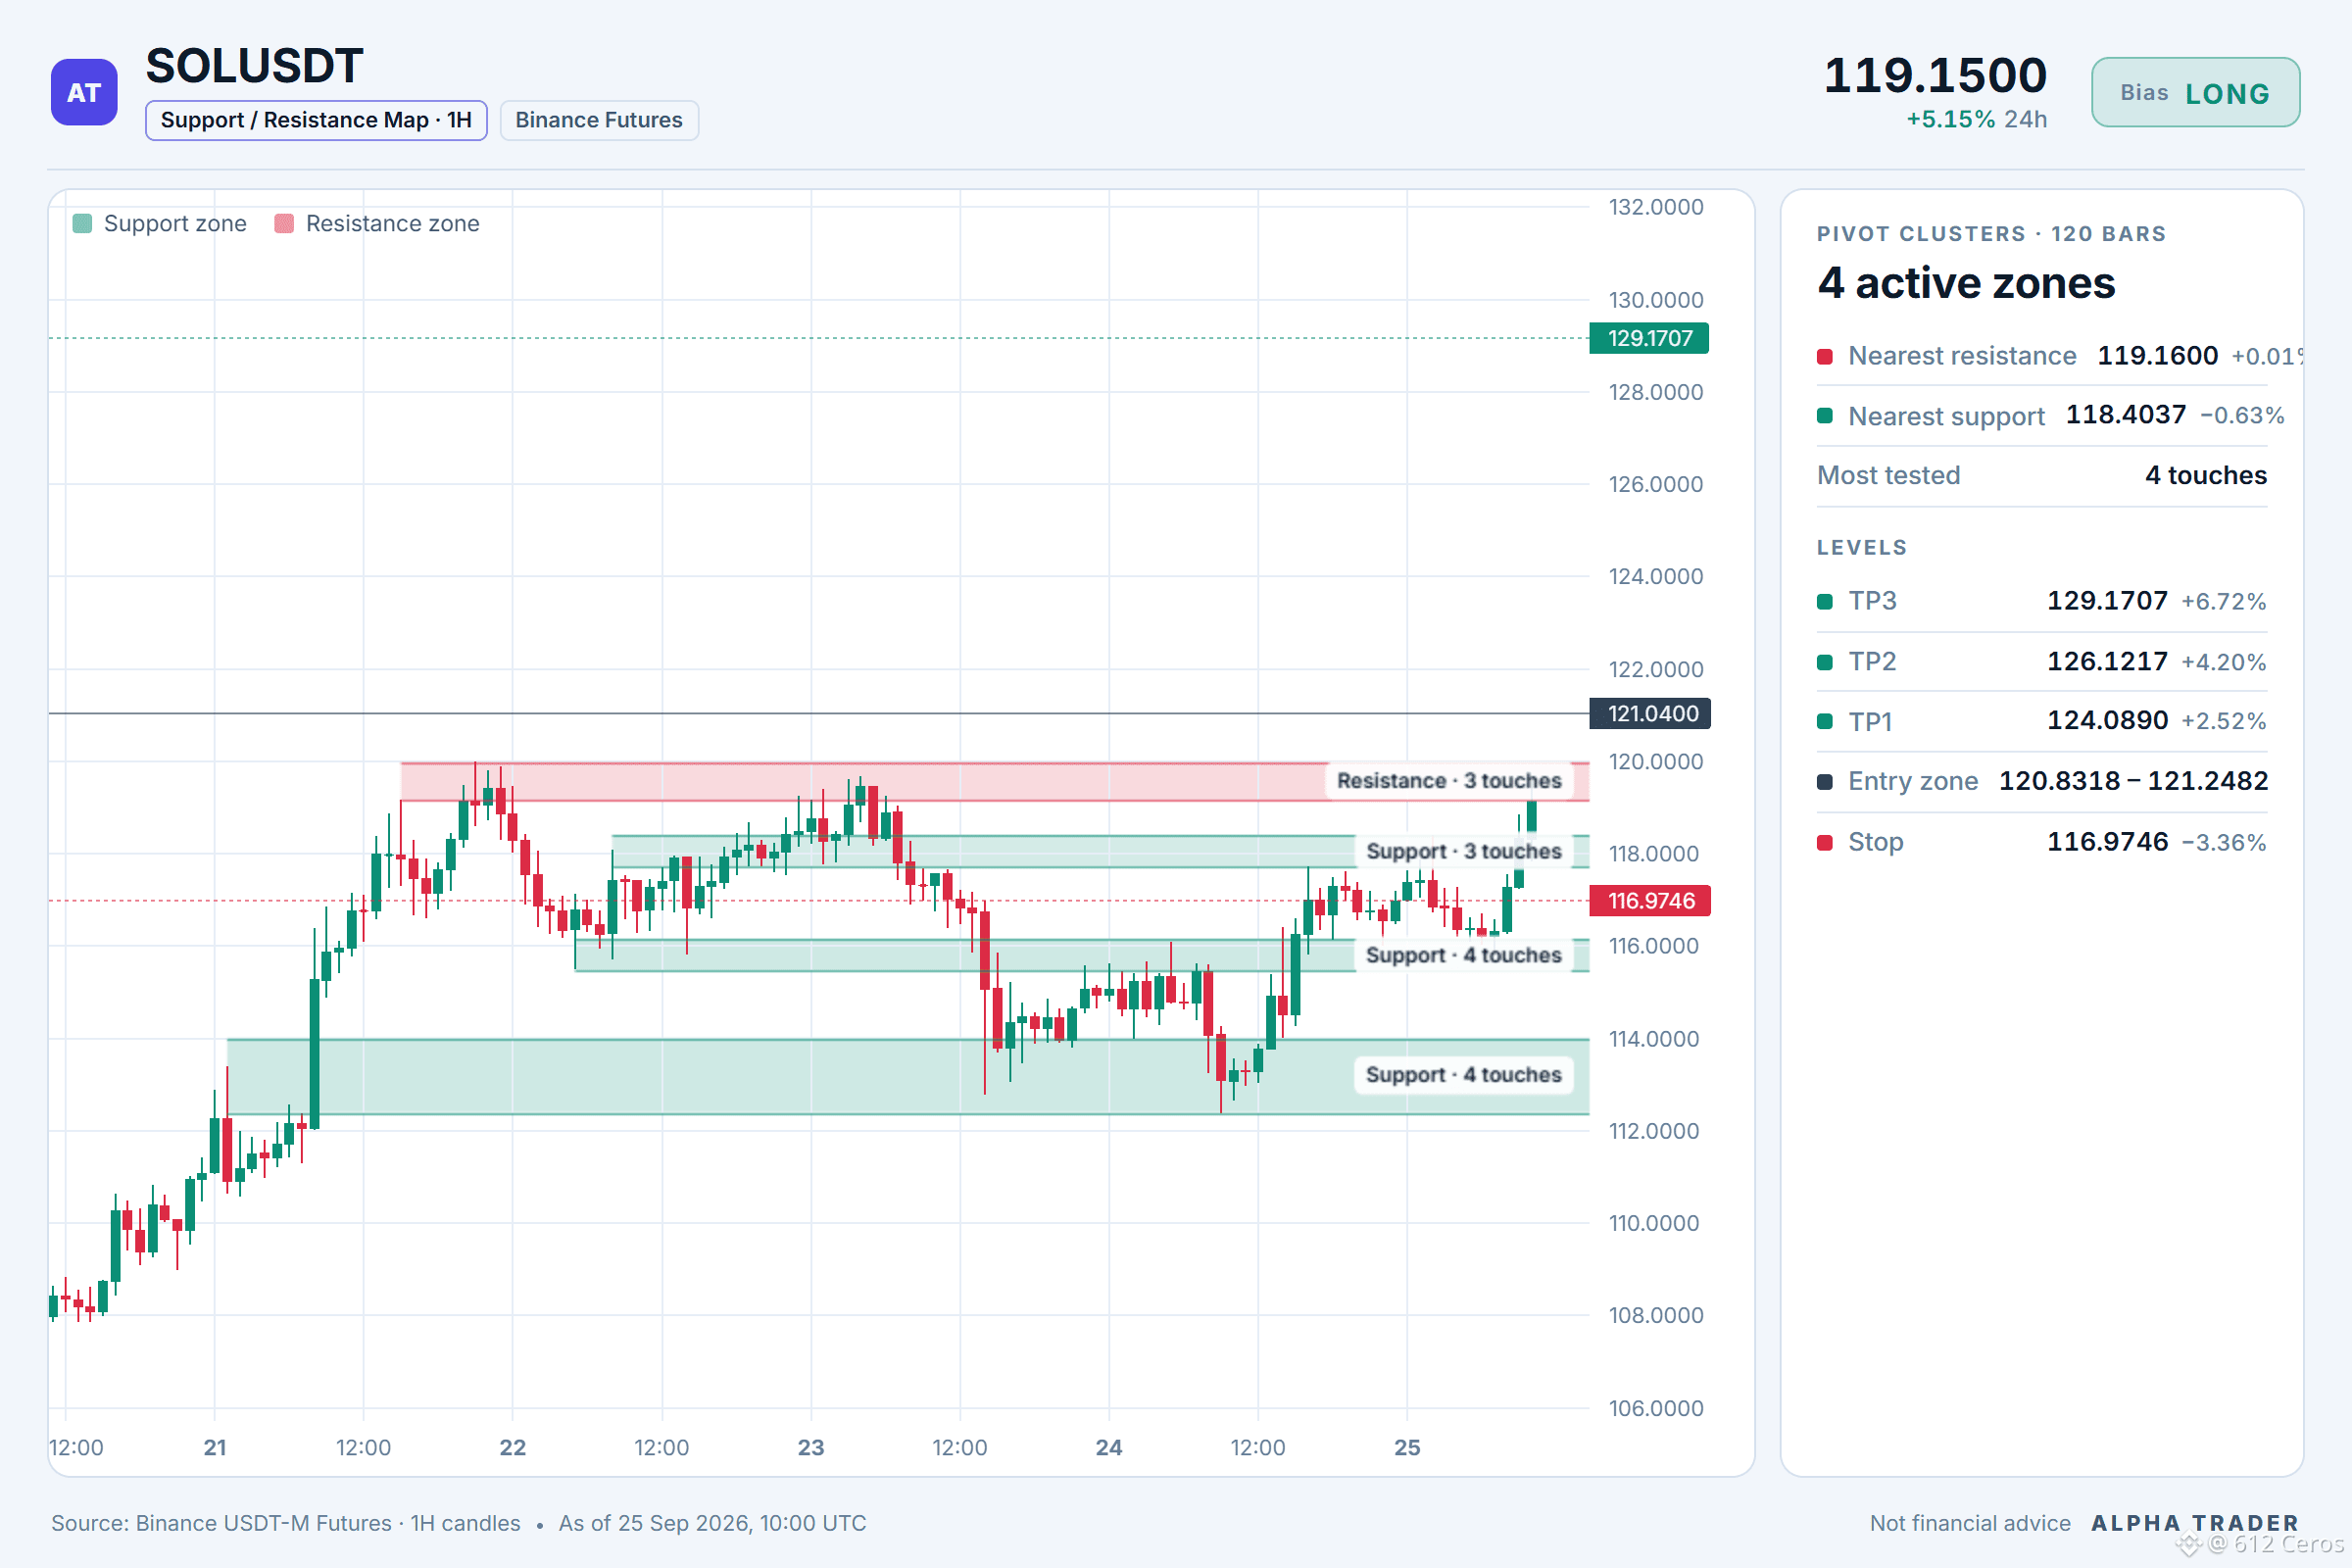
Entry: 120.8318 – 121.2482
SL: 116.9746
TP1: 124.0890
TP2: 126.1217
TP3: 129.1707
Why now?
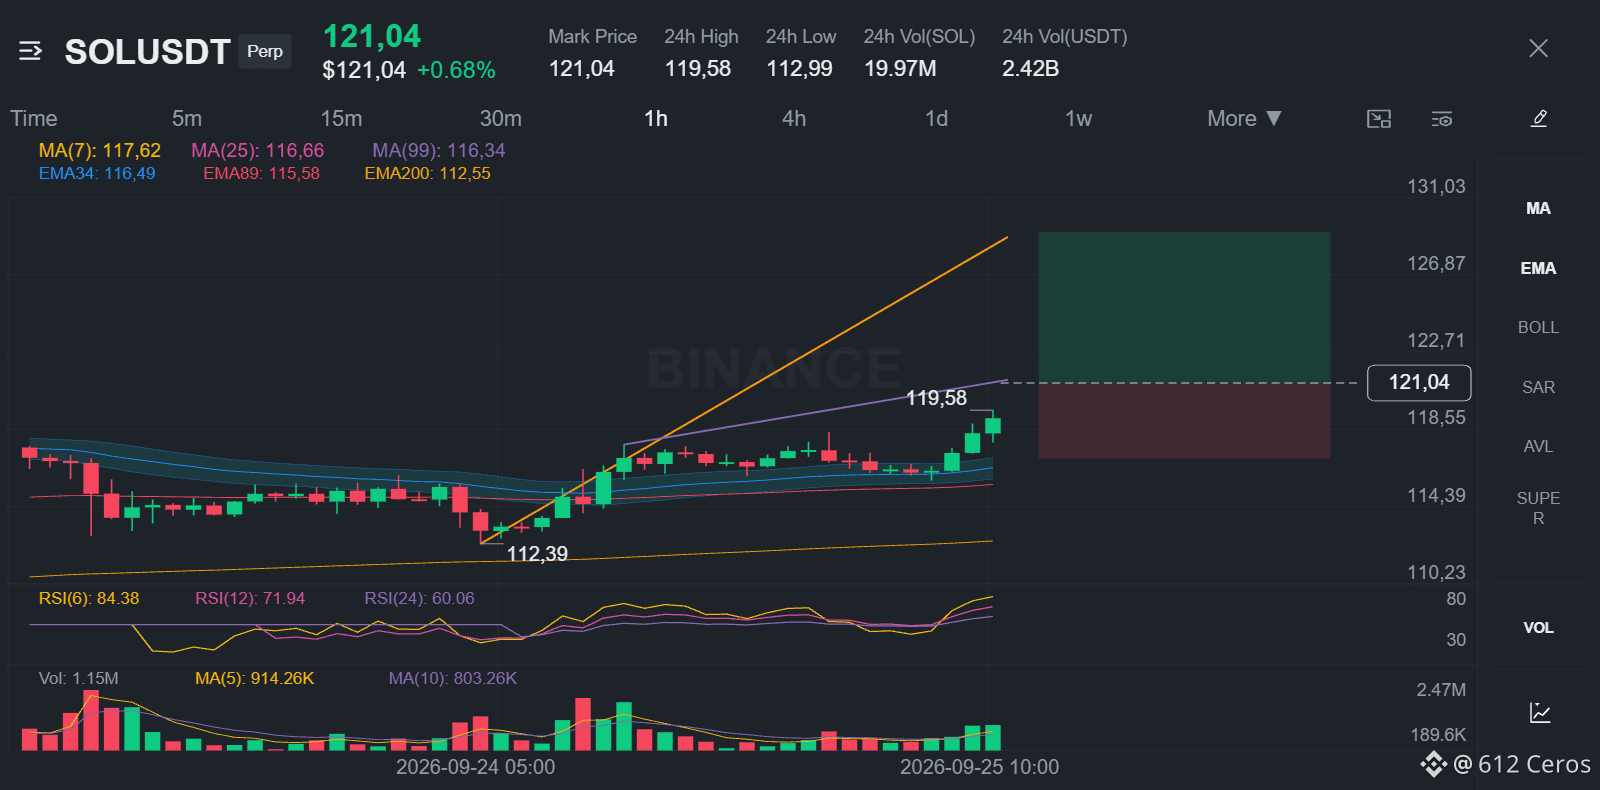
The daily trend reads bullish, and 8/12 signals aligned favour the long side. The plan is to work the 120.8318 – 121.2482 zone, scale out at 124.0890 and 126.1217, and stay patient for 129.1707. A move through 116.9746 means the idea is wrong and the stop does its job.
💬 Does SOL tag 124.0890 first, or the stop?
Levels mapped on the chart below 👇
📲 Want more of my latest signals? Join me here:
https://app.binance.com/uni-qr/D26WbL9t
⚠️ Personal market analysis only. NFA — manage risk and DYOR.
Educational content, not investment advice or a recommendation to buy, sell, deposit, or withdraw any asset. No paid promotion; the invite link above is my own referral link, and I may earn a commission if you sign up through it — at no extra cost to you.
$SOL /USDT - 🟢 Bias: LONG (Strong) · 8/12 signals aligned
Technical verdict: STRONG LONG. 8 of 12 signals aligned, 1 against.
✅ Daily trend: price > EMA50 > EMA200, bullish stack
✅ 4h trend: price > EMA50 > EMA200, bullish stack
✅ 1h trend: price > EMA50 > EMA200, bullish stack
✅ Trend strength (ADX/DI, 15m): ADX 41.2 with buyers in control (DI+ 40.9 vs DI− 4.8)
✅ BTC backdrop: BTC trend is bullish and correlation is 0.84
✅ 4h RSI: 55.2, bullish momentum (above 55)
⚠️ Distance from 1h EMA50: +4.2 ATR from the 1h EMA50, overextended with pullback risk
Trade Plan:
Entry: 120.8318 – 121.2482
SL: 116.9746
TP1: 124.0890
TP2: 126.1217
TP3: 129.1707
Why now?
The daily trend reads bullish, and 8/12 signals aligned favour the long side. The plan is to work the 120.8318 – 121.2482 zone, scale out at 124.0890 and 126.1217, and stay patient for 129.1707. A move through 116.9746 means the idea is wrong and the stop does its job.
💬 Does SOL tag 124.0890 first, or the stop?
Levels mapped on the chart below 👇
📲 Want more of my latest signals? Join me here:
https://app.binance.com/uni-qr/D26WbL9t
⚠️ Personal market analysis only. NFA — manage risk and DYOR.
Educational content, not investment advice or a recommendation to buy, sell, deposit, or withdraw any asset. No paid promotion; the invite link above is my own referral link, and I may earn a commission if you sign up through it — at no extra cost to you.