🚨 $QNT IS APPROACHING A KEY BREAKOUT ZONE
Guys, Quant ($QNT ) is starting to look interesting here. 👀
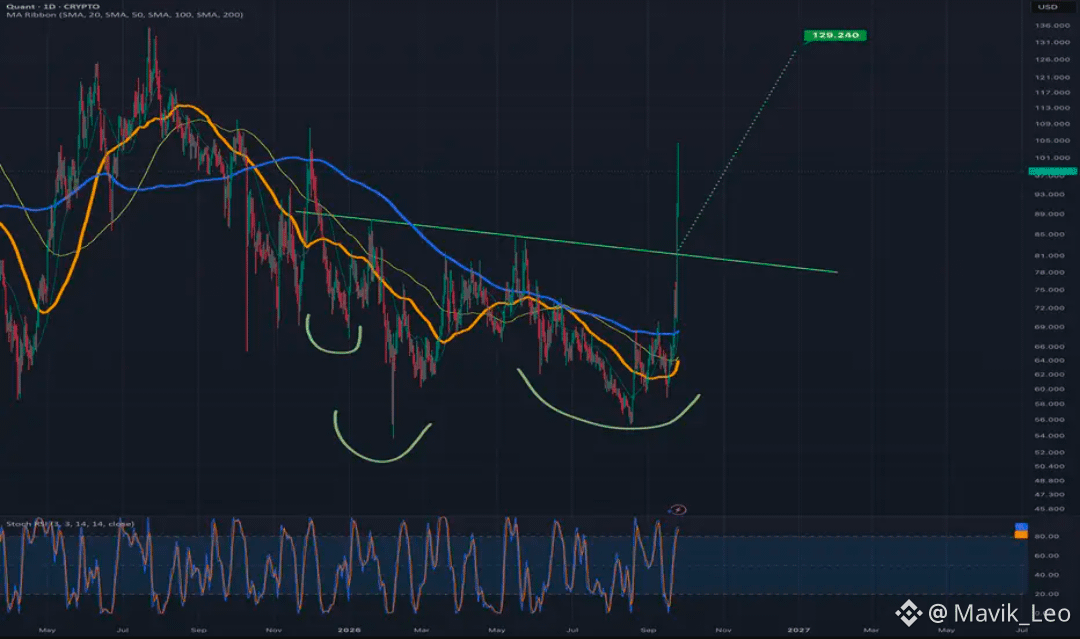
The chart shows an inverse head-and-shoulders structure that has broken above the descending neckline.
That’s the important signal.
If QNT can hold above the breakout area and build support there, the measured move points toward roughly $129–130, which is still a significant distance from the current level.
What I’m watching next:
📌 Neckline breakout → already visible
📌 Hold above breakout → confirmation
📌 Target → ~$129.24
📌 Bigger structure → possible double-bottom formation
The recent fundamental developments may be contributing to sentiment, but the technical structure is what stands out on this chart.
If momentum continues, QNT could have more room to run before reaching the full pattern target. 📈
The real question: can QNT turn this breakout into sustained support?
Not financial advice.$QI $ARK
Guys, Quant ($QNT ) is starting to look interesting here. 👀
The chart shows an inverse head-and-shoulders structure that has broken above the descending neckline.
That’s the important signal.
If QNT can hold above the breakout area and build support there, the measured move points toward roughly $129–130, which is still a significant distance from the current level.
What I’m watching next:
📌 Neckline breakout → already visible
📌 Hold above breakout → confirmation
📌 Target → ~$129.24
📌 Bigger structure → possible double-bottom formation
The recent fundamental developments may be contributing to sentiment, but the technical structure is what stands out on this chart.
If momentum continues, QNT could have more room to run before reaching the full pattern target. 📈
The real question: can QNT turn this breakout into sustained support?
Not financial advice.$QI $ARK