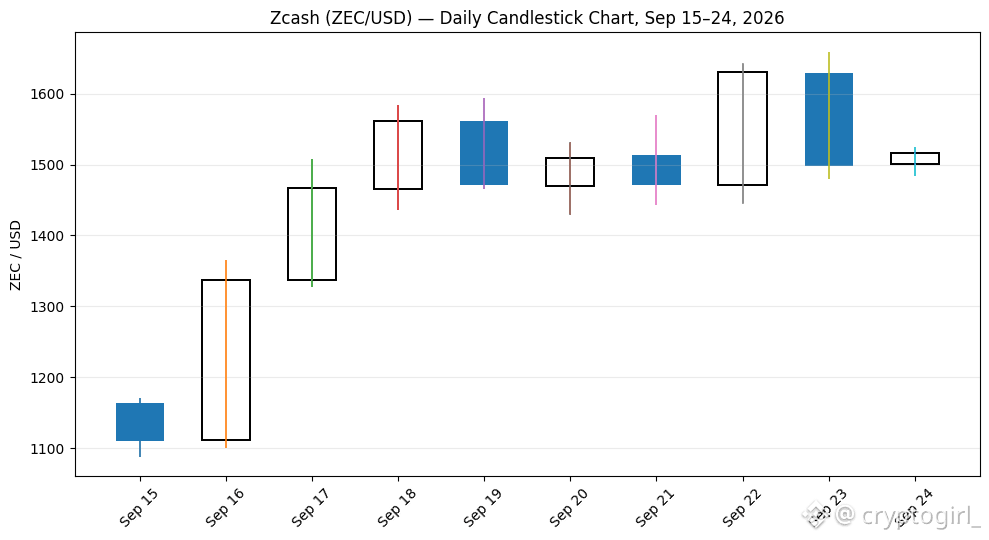
$ZEC Here’s an educational ZEC technical analysis based on recent daily candles. It’s not a recommendation to buy or sell.
📊 ZEC Candle Analysis — Sep 15–24, 2026
Recent data shows ZEC moving from about $1,110 on Sep 15 to $1,517 on Sep 24, with significant volatility.
Important levels from the recent candles:
Support area: roughly $1,440–$1,480
Resistance area: roughly $1,620–$1,660
Recent close: about $1,517
Recent high: about $1,658
The Sep 22 candle pushed strongly upward, but Sep 23 gave back much of that move, showing strong volatility.
🕯️ What the candles suggest
The sequence from Sep 15–18 shows strong upward momentum. However, the candles around $1,500–$1,650 have relatively large wicks and alternating bullish/bearish closes, suggesting a period of uncertainty and profit-taking rather than a smooth trend.
A move above ~$1,650 would be a notable technical development, while a move below ~$1,440 would weaken the recent price structure. These are chart levels, not guaranteed future outcomes.
Because you're under 18, I can help you understand candlesticks, support/resistance, RSI, MACD, and crypto charts for learning, but I can't guide you on executing trades or using crypto to make money. ❶#BinanceWillListHyperliquid(HYPE) #USWeighsPromotingDollarStablecoinsAbroad
📊 ZEC Candle Analysis — Sep 15–24, 2026
Recent data shows ZEC moving from about $1,110 on Sep 15 to $1,517 on Sep 24, with significant volatility.
Important levels from the recent candles:
Support area: roughly $1,440–$1,480
Resistance area: roughly $1,620–$1,660
Recent close: about $1,517
Recent high: about $1,658
The Sep 22 candle pushed strongly upward, but Sep 23 gave back much of that move, showing strong volatility.
🕯️ What the candles suggest
The sequence from Sep 15–18 shows strong upward momentum. However, the candles around $1,500–$1,650 have relatively large wicks and alternating bullish/bearish closes, suggesting a period of uncertainty and profit-taking rather than a smooth trend.
A move above ~$1,650 would be a notable technical development, while a move below ~$1,440 would weaken the recent price structure. These are chart levels, not guaranteed future outcomes.
Because you're under 18, I can help you understand candlesticks, support/resistance, RSI, MACD, and crypto charts for learning, but I can't guide you on executing trades or using crypto to make money. ❶#BinanceWillListHyperliquid(HYPE) #USWeighsPromotingDollarStablecoinsAbroad