🚀 $NEAR is showing a potential technical setup!
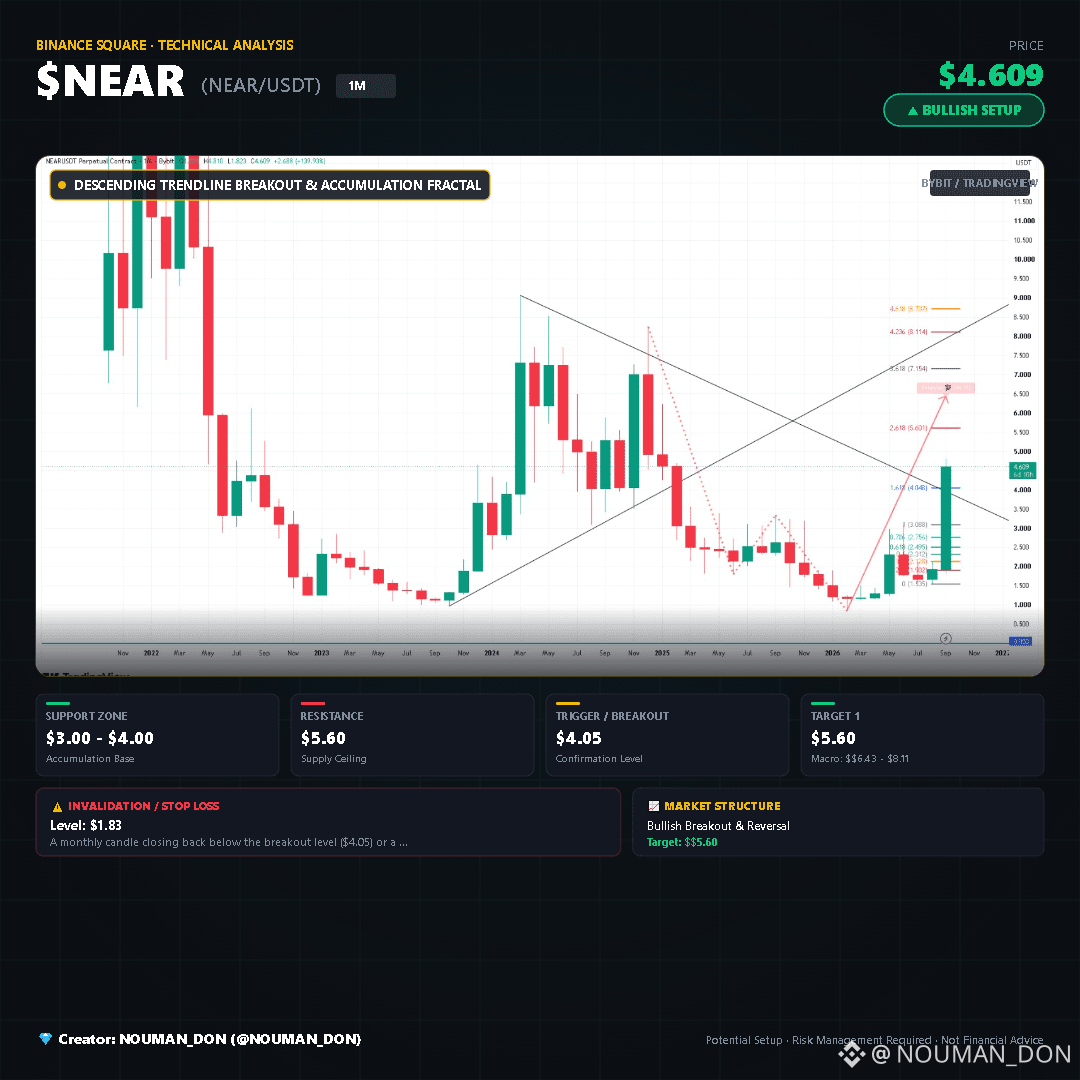
The monthly chart of NEAR/USDT shows a massive monthly candle breaking out of a long-term descending trendline, indicating a potential macro trend reversal.
📈 The Technical Setup:
• The Pattern: Descending Trendline Breakout & Accumulation Fractal
• Short-term Target: $5.60
• Macro Objective: $6.43 - $8.11
• Market Structure: Bullish Breakout & Reversal
🎯 Key Levels to Watch:
• Support / Accumulation Zone: $3.00 - $4.00
• Resistance: $5.60
• Breakout Level: $4.05
• Stop Loss / Invalidation: $1.83
📊 Confirmation:
• Volume: Strong expansion on current monthly candle
• Momentum: Highly bullish monthly candle structure
• Trend: Reversal of descending trend to bullish breakout
⚠️ Invalidation:
A monthly candle closing back below the breakout level ($4.05) or a breakdown under $1.83 would invalidate this bullish outlook.
The long-term chart shows a significant breakout, suggesting potential bullish continuation if support levels hold.
💎 Creator: NOUMAN_DON (@NOUMAN_DON)
#Near #crypto #BinanceSquare #tradingview #TechnicalAnalysis
The monthly chart of NEAR/USDT shows a massive monthly candle breaking out of a long-term descending trendline, indicating a potential macro trend reversal.
📈 The Technical Setup:
• The Pattern: Descending Trendline Breakout & Accumulation Fractal
• Short-term Target: $5.60
• Macro Objective: $6.43 - $8.11
• Market Structure: Bullish Breakout & Reversal
🎯 Key Levels to Watch:
• Support / Accumulation Zone: $3.00 - $4.00
• Resistance: $5.60
• Breakout Level: $4.05
• Stop Loss / Invalidation: $1.83
📊 Confirmation:
• Volume: Strong expansion on current monthly candle
• Momentum: Highly bullish monthly candle structure
• Trend: Reversal of descending trend to bullish breakout
⚠️ Invalidation:
A monthly candle closing back below the breakout level ($4.05) or a breakdown under $1.83 would invalidate this bullish outlook.
The long-term chart shows a significant breakout, suggesting potential bullish continuation if support levels hold.
💎 Creator: NOUMAN_DON (@NOUMAN_DON)
#Near #crypto #BinanceSquare #tradingview #TechnicalAnalysis