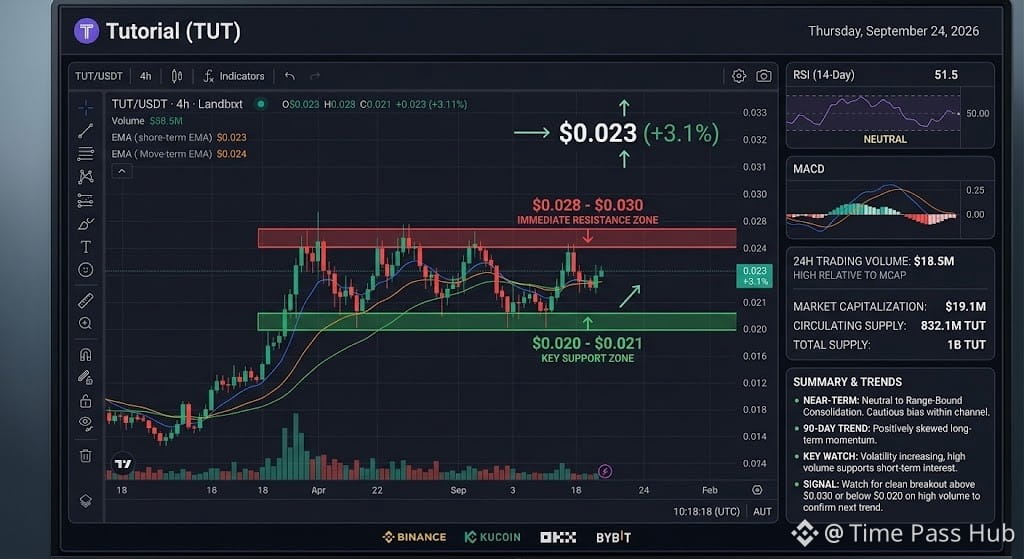
Tutorial ($TUT ) is trading in the range of $0.021 – $0.025 USD, consolidating after strong multi-month gains earlier in the quarter.
Key Market Metrics Today
Current Price: ~$0.021 – $0.025 USD
24-Hour Price Action: Ranging from -3.8% to +3.1% depending on the exchange/pair
Market Capitalization: ~$17.5M – $20.8M USD
24-Hour Trading Volume: ~$11.0M – $21.5M USD
Circulating Supply: ~831M – 833M TUT
Technical & Trend Breakdown
1. High Volume Relative to Market Cap
TUT is currently experiencing elevated trading volume relative to its total market cap. This elevated volume indicates high speculative turnover and short-term trader interest, which often leads to rapid, volatile local price swings.
2. Support and Resistance Levels
Immediate Resistance: $0.028 – $0.030 USD. A sustained daily close above $0.030 on strong volume could reignite upward momentum toward the $0.035 level.
Key Support Zone: $0.020 – $0.021 USD. Holding above $0.020 is critical to prevent short-term trend breakdown. A drop below $0.020 risks a test of lower support near $0.015 – $0.017.
3. Moving Averages & Oscillators
RSI (14-Day): Hovering in the 45 – 52 neutral region, indicating balanced momentum between buyers and sellers following recent pullbacks.
Trend Structure: TUT has shown positive long-term momentum over a 90-day horizon, but short-term timeframes lean neutral as price consolidates within its current horizontal channel.
Summary
The near-term outlook for TUT remains neutral to range-bound. Price action is consolidating between $0.020 support and $0.028 resistance. Watch for a volume-backed breakout outside this range to establish the next clear directional trend.
#TUT1Dollar #Binance #BinanceSquare #Write2Earn #news $TUT
$NIL
Key Market Metrics Today
Current Price: ~$0.021 – $0.025 USD
24-Hour Price Action: Ranging from -3.8% to +3.1% depending on the exchange/pair
Market Capitalization: ~$17.5M – $20.8M USD
24-Hour Trading Volume: ~$11.0M – $21.5M USD
Circulating Supply: ~831M – 833M TUT
Technical & Trend Breakdown
1. High Volume Relative to Market Cap
TUT is currently experiencing elevated trading volume relative to its total market cap. This elevated volume indicates high speculative turnover and short-term trader interest, which often leads to rapid, volatile local price swings.
2. Support and Resistance Levels
Immediate Resistance: $0.028 – $0.030 USD. A sustained daily close above $0.030 on strong volume could reignite upward momentum toward the $0.035 level.
Key Support Zone: $0.020 – $0.021 USD. Holding above $0.020 is critical to prevent short-term trend breakdown. A drop below $0.020 risks a test of lower support near $0.015 – $0.017.
3. Moving Averages & Oscillators
RSI (14-Day): Hovering in the 45 – 52 neutral region, indicating balanced momentum between buyers and sellers following recent pullbacks.
Trend Structure: TUT has shown positive long-term momentum over a 90-day horizon, but short-term timeframes lean neutral as price consolidates within its current horizontal channel.
Summary
The near-term outlook for TUT remains neutral to range-bound. Price action is consolidating between $0.020 support and $0.028 resistance. Watch for a volume-backed breakout outside this range to establish the next clear directional trend.
#TUT1Dollar #Binance #BinanceSquare #Write2Earn #news $TUT
$NIL