$ZEC
$ZEC ⚡️ Pulling Back From the Highs — But Most of This Move Is Still Intact
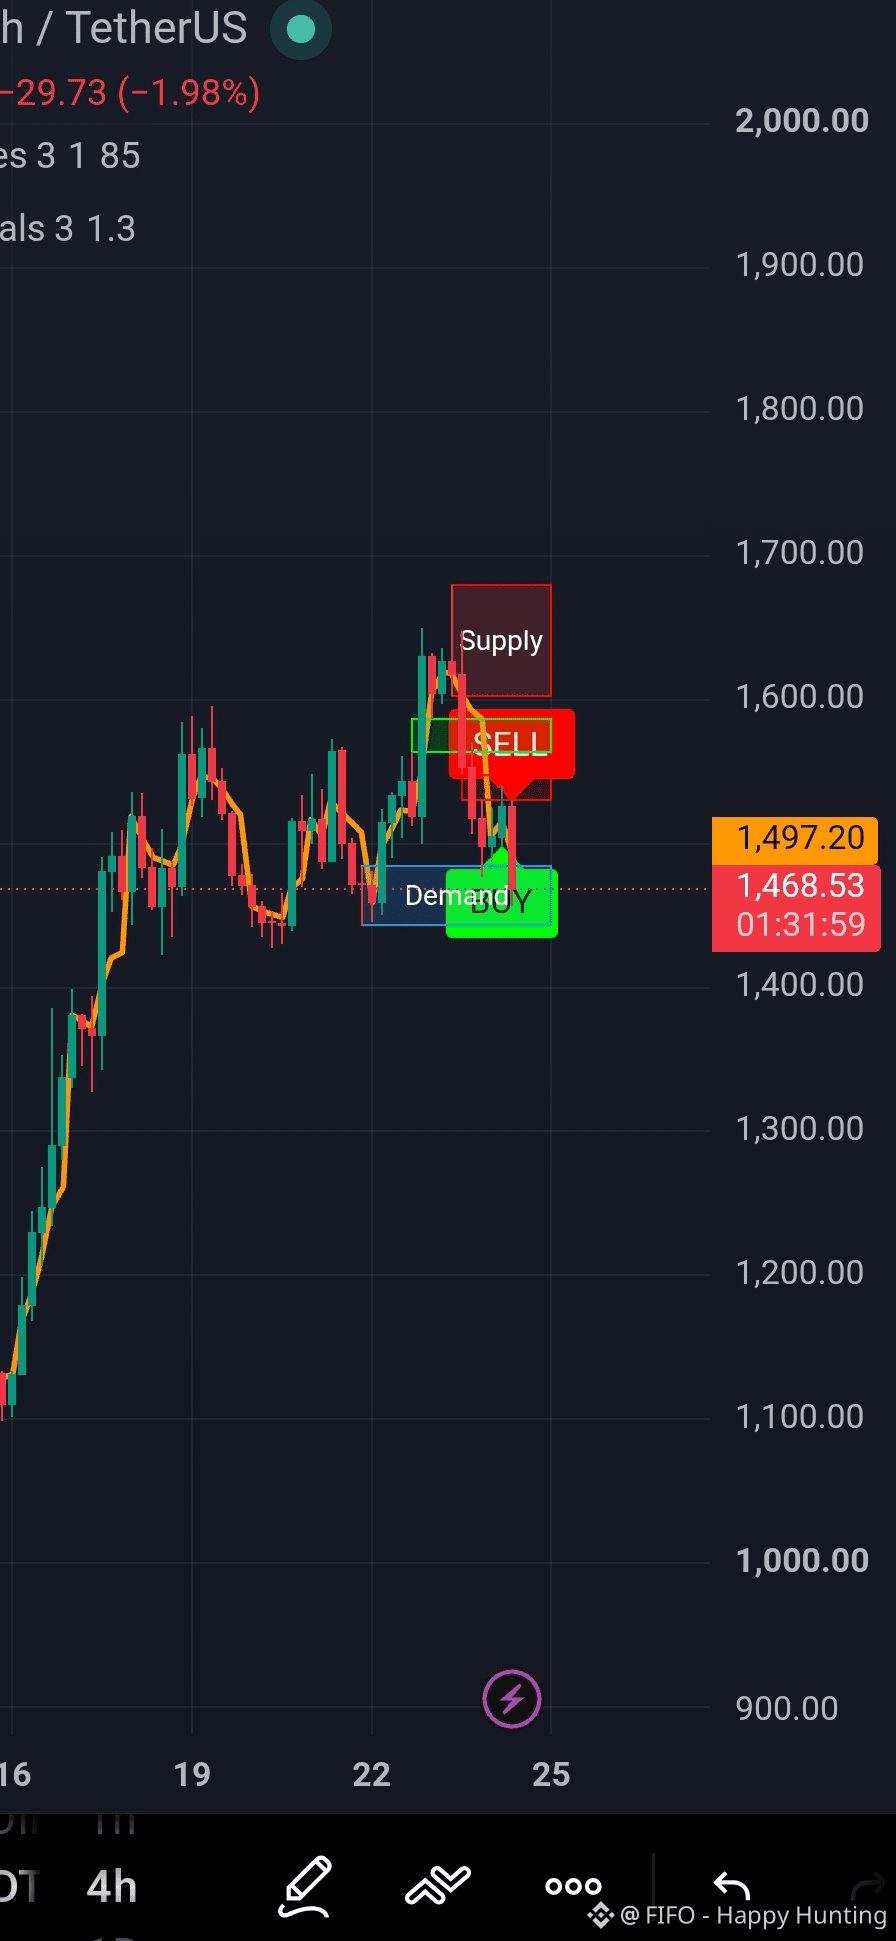
One thing standing out on this chart: ZEC is down 1.98% to $1,468.53, retesting the demand zone that's held before after rejecting near $1,685. Short-term price action looks weak, but the bigger picture tells a different story.
What is happening:
Price is down roughly 13% from the recent high.
It's still up about 41% from the base of this move near $1,040.
The current demand zone (~$1,440–1,500) is the same general area that's absorbed selling before.
What it may mean:
This pullback may suggest the market is cooling off after an extended run rather than reversing outright. If this zone holds, the broader structure since the breakout remains intact.
Risk / invalidation:
That said, if this zone fails and price keeps sliding, the pullback becomes harder to read as healthy — a break well below this demand zone would be the first real sign the broader trend is actually turning, not just resting.
Bullish case: the move is still up over 40% from its base; one rejection at highs doesn't erase that.
Risk case: repeated failures at resistance followed by deeper pullbacks can eventually exhaust a trend.
What are you watching most here — whether this demand zone holds, or how price behaves if it doesn't?
Not financial advice — structure and scenarios, not a signal.
$ZEC ⚡️ Pulling Back From the Highs — But Most of This Move Is Still Intact
One thing standing out on this chart: ZEC is down 1.98% to $1,468.53, retesting the demand zone that's held before after rejecting near $1,685. Short-term price action looks weak, but the bigger picture tells a different story.
What is happening:
Price is down roughly 13% from the recent high.
It's still up about 41% from the base of this move near $1,040.
The current demand zone (~$1,440–1,500) is the same general area that's absorbed selling before.
What it may mean:
This pullback may suggest the market is cooling off after an extended run rather than reversing outright. If this zone holds, the broader structure since the breakout remains intact.
Risk / invalidation:
That said, if this zone fails and price keeps sliding, the pullback becomes harder to read as healthy — a break well below this demand zone would be the first real sign the broader trend is actually turning, not just resting.
Bullish case: the move is still up over 40% from its base; one rejection at highs doesn't erase that.
Risk case: repeated failures at resistance followed by deeper pullbacks can eventually exhaust a trend.
What are you watching most here — whether this demand zone holds, or how price behaves if it doesn't?
Not financial advice — structure and scenarios, not a signal.