$TRX
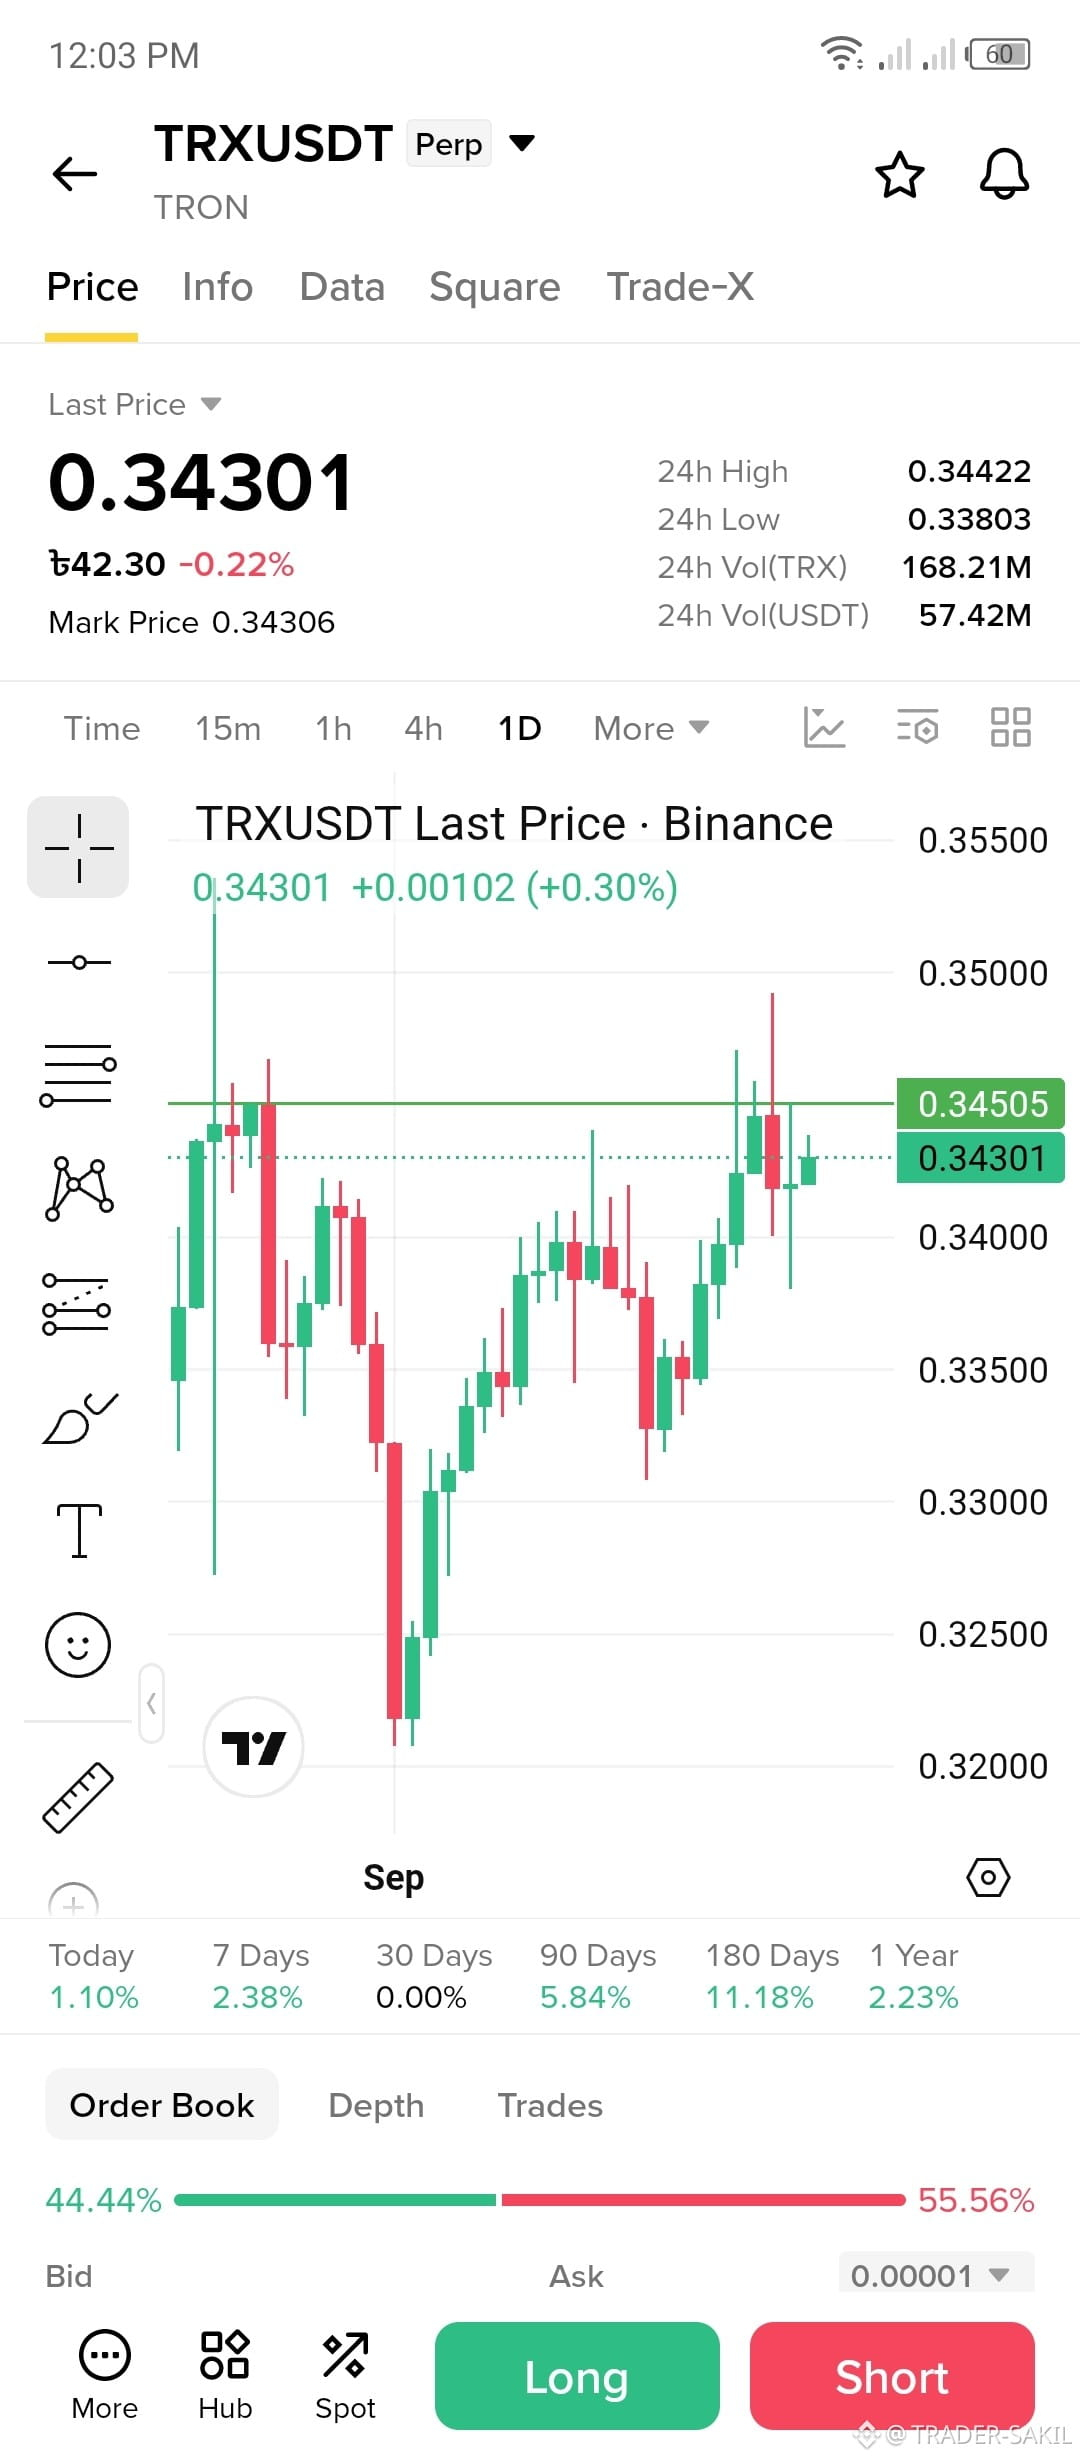
TRX/USDT 1D Chart Analysis
Current price: around $0.3430
24H range:$0.3380 – $0.3442
The daily chart shows a recovery from the ~$0.321 area. After forming a low, TRX has been making a series of higher lows and pushing back toward the $0.345 resistance
Resistance:~$0.345, then $0.350–$0.355
Support:~$0.340, followed by $0.335 and the stronger ~$0.330–$0.321 zone.
Price is currently sitting just below $0.345, so a daily close above that level would show stronger bullish momentum. Failure to break it could lead to another pullback toward $0.340 or lower.
The order book shown has 44.44% bids vs 55.56% asks indicating more sell-side orders in this snapshot, but order-book ratios can change quickly and shouldn't be treated as a standalone signal.
Caveat:This is only one 1D chart snapshot. It doesn't show indicators such as RSI, MACD, or broader market conditions, so the chart alone cannot confirm whether the resistance will break.
TRX/USDT 1D Chart Analysis
Current price: around $0.3430
24H range:$0.3380 – $0.3442
The daily chart shows a recovery from the ~$0.321 area. After forming a low, TRX has been making a series of higher lows and pushing back toward the $0.345 resistance
Resistance:~$0.345, then $0.350–$0.355
Support:~$0.340, followed by $0.335 and the stronger ~$0.330–$0.321 zone.
Price is currently sitting just below $0.345, so a daily close above that level would show stronger bullish momentum. Failure to break it could lead to another pullback toward $0.340 or lower.
The order book shown has 44.44% bids vs 55.56% asks indicating more sell-side orders in this snapshot, but order-book ratios can change quickly and shouldn't be treated as a standalone signal.
Caveat:This is only one 1D chart snapshot. It doesn't show indicators such as RSI, MACD, or broader market conditions, so the chart alone cannot confirm whether the resistance will break.