$NVDA.US 📊 Trading Candles — Learn Before You Trade
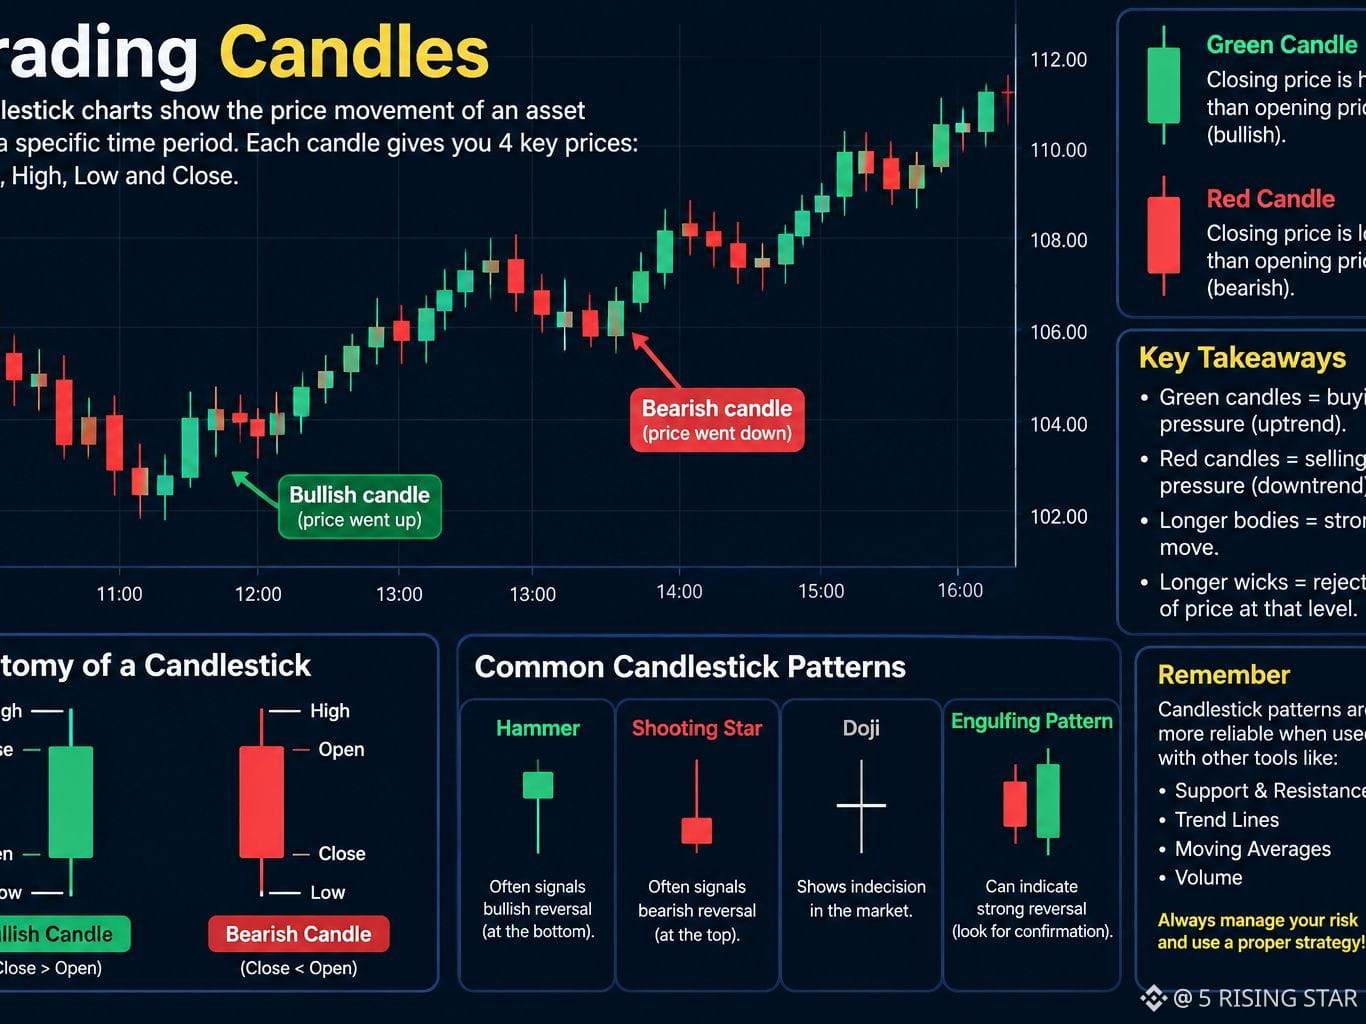
Candlestick charts help traders understand price movement.
🟢 Green candle: Closing price is higher than the opening price.
🔴 Red candle: Closing price is lower than the opening price.
Key things to watch:
• Candle body size
• Upper and lower wicks
• Support & resistance
• Trend direction
• Volume
Common patterns include Hammer, Shooting Star, Doji, and Engulfing.
Remember: Candlestick patterns are signals, not guarantees. Always use proper risk management. 📈📉
Candlestick charts help traders understand price movement.
🟢 Green candle: Closing price is higher than the opening price.
🔴 Red candle: Closing price is lower than the opening price.
Key things to watch:
• Candle body size
• Upper and lower wicks
• Support & resistance
• Trend direction
• Volume
Common patterns include Hammer, Shooting Star, Doji, and Engulfing.
Remember: Candlestick patterns are signals, not guarantees. Always use proper risk management. 📈📉