




Access Binance OTC desk on the VIP Portal
Period: September 18 – September 24, 2026
Market Sentiment: Greed Consolidates as Confidence Broadens
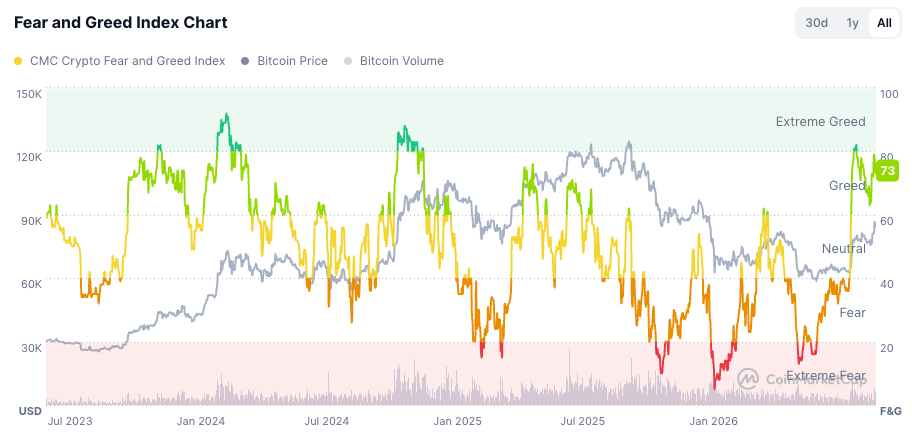
Market sentiment stayed firmly constructive this week, with the CoinMarketCap Fear and Greed Index sitting at 73, comfortably inside the Greed zone. Unlike the sharp jump seen in early September, this week's reading reflects a more sustained state of optimism rather than a fresh spike. Sentiment has moved from "recovering" to "trending," which is an important distinction — the market is no longer simply bouncing off fear; it is holding elevated risk appetite over consecutive sessions.
The persistence of the Greed reading suggests that participants are increasingly treating the recovery as the base case. Positioning is no longer purely defensive, and traders appear more willing to hold directional exposure and add risk. That said, a mid-70s Greed print is a double-edged signal: it confirms confidence, but it also means the market has less margin for disappointment, and sentiment-driven pullbacks can be sharp when expectations run ahead of follow-through.
Key takeaways:
The Fear and Greed Index sits at 73, holding in the Greed zone.
Sentiment is now trending and sustained, not just a one-off rebound.
The reading indicates continuing market confidence and optimism.
Risk appetite remains elevated across spot and derivatives participants.
A persistent Greed signal supports the recovery narrative but raises sensitivity to short-term shocks.
Confidence is broadening, but confirmation via price stability and flows remains important.
Overall, the sentiment backdrop is supportive and increasingly stable. The market is behaving as though the recovery has legs, while the elevated Greed level means follow-through will matter more than the headline reading itself.
Figure 1: Fear and Greed Index Chart
Price Action: BTC Extends Its Recovery Into the Mid-$80Ks
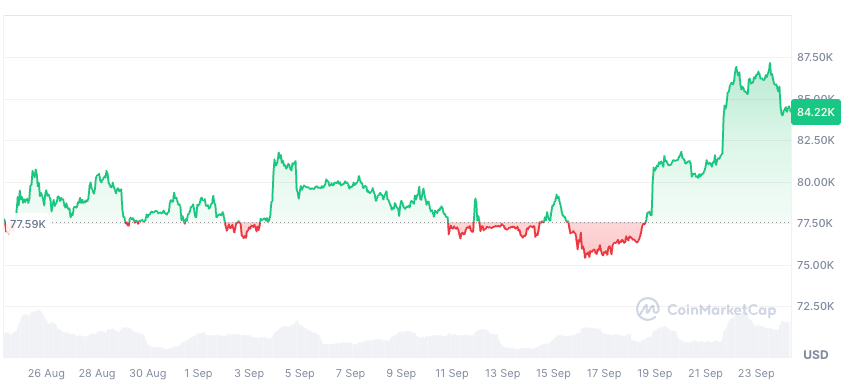
Bitcoin extended its recovery this week, climbing from roughly $77.5K in mid-September to around $84.22K, with the price probing the $85K zone and printing a local high near $87.5K during the run. The move marks a clean break above the late-August/early-September consolidation range and signals that buyers have regained control of the short-term trend.
The structure of the rally is notable: it was driven by steady, higher-lows progression rather than a single spike, which suggests genuine demand rather than a reflexive squeeze. At the same time, the velocity of the move higher means short-term volatility has not disappeared — the market is more reactive to flows and positioning, and pullbacks within an uptrend remain a normal feature of this environment.
Key takeaways:
BTC recovered from about $77.5K to roughly $84.22K over the week.
Price pushed into the $85K zone, with a local high near $87.5K.
The uptrend was characterized by higher lows, pointing to sustained demand.
The recovery is now momentum-driven, not merely a stabilization bounce.
Higher prices and faster moves keep short-term volatility elevated.
Follow-through above the mid-$80Ks is the key confirmation signal to watch.
Overall, price action confirms the improvement in sentiment. The recovery is broadening, but the market remains sensitive to positioning and flow-driven swings.
Figure 2: Bitcoin Price Chart
ETF Flows: Institutional Confidence Rebuilds With a Multi-Billion-Dollar Week
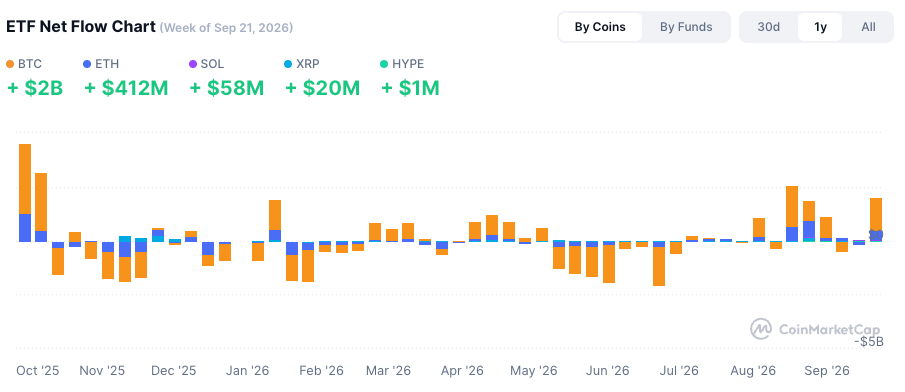
ETF flows delivered the strongest institutional signal of this recovery phase. For the week of September 21, net inflows were led decisively by BTC, with a surge of roughly $1.5B into BTC ETFs. ETH followed with around +$412M, while SOL, XRP, and HYPE added smaller but constructive contributions.
The scale and spread of this week's inflows is a meaningful upgrade from early September, when demand was real but uneven. The return of multi-billion-dollar weekly BTC inflows suggests that institutional allocators are rebuilding confidence and becoming more comfortable adding exposure as price momentum confirms. The breadth across ETH and select altcoins further signals that demand is no longer confined to BTC alone.
ETF flow
BTC ETF net inflows reached near $1.5B.
ETH ETF inflows were ~+$412M, confirming renewed appetite.
SOL, XRP, HYPE added breadth.
BTC remains the dominant driver, but flows are broadening across large-cap assets.
This week's inflows represent a clear step up in institutional participation.
Sustained multi-week inflows would confirm a durable institutional re-accumulation phase.
Combined interpretation:
The return of multi-billion-dollar weekly inflows is a strong constructive signal for institutional sentiment.
ETH inflows becoming more meaningful shows confidence spreading beyond BTC.
Broader altcoin participation (SOL, XRP) supports a healthier, less concentrated bid.
Flows now align with the price recovery and the Greed reading, reinforcing the narrative.
The key question is whether this pace can be sustained, not just concentrated in one week.
Overall, ETF demand has shifted from "selective" to "re-accumulating." This week's figures provide the clearest institutional confirmation yet that the recovery is becoming more durable.
Figure 3: ETF Net Flow Chart
Derivatives & Liquidations: A Short Squeeze Reinforces the Uptrend, Long Leverage Remains Structurally Heavier
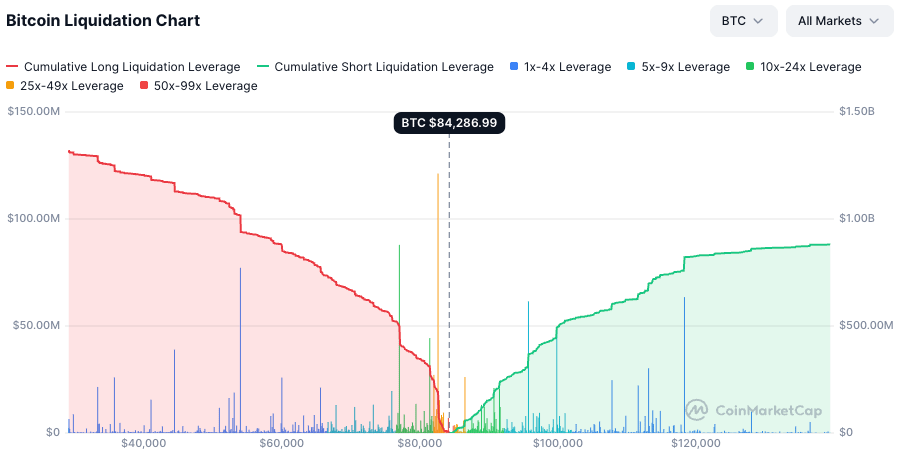
Derivatives activity added an important layer to the recovery story this week. The rally into the mid-$80Ks triggered a short liquidation squeeze, as traders positioned for downside were forced to cover into rising prices. On the cumulative liquidation chart, short liquidation leverage has been climbing steadily, while the earlier wave of long liquidations (concentrated around late August/early September) has largely been exhausted. That combination — shorts being squeezed while long-side deleveraging is already complete — is a classic upward-momentum signature.
Structurally, however, the market is not symmetric. Long positions remain more leveraged than short positions, meaning the aggregate long side carries more borrowed exposure per unit of positioning. In practice, this means:
The immediate trend is being reinforced by short covering, which adds fuel to the rally.
But the elevated long leverage means the market is more fragile to a downward shock — if price reverses, a wave of long liquidations could amplify the move.
The leverage mix therefore supports the recovery while it lasts, but it is also the primary risk if momentum stalls.
Key takeaways:
The rally triggered a short liquidation squeeze into the $85K zone.
Cumulative short liquidation leverage is rising, confirming shorts are being forced out.
Earlier long liquidations from late August/early September have largely been flushed.
Long positions remain structurally more leveraged than short positions.
The leverage mix supports upside momentum but increases downside fragility.
Derivatives positioning is now a key sensitivity to monitor, alongside price follow-through.
Overall, the derivatives picture reinforces the uptrend — a short squeeze alongside a cleaned-out long side is fuel for continuation. But the persistent long-leverage overhang means the market is not immune to sharp reversals if sentiment or flows disappoint.
Figure 4: Historical Liquidations Chart
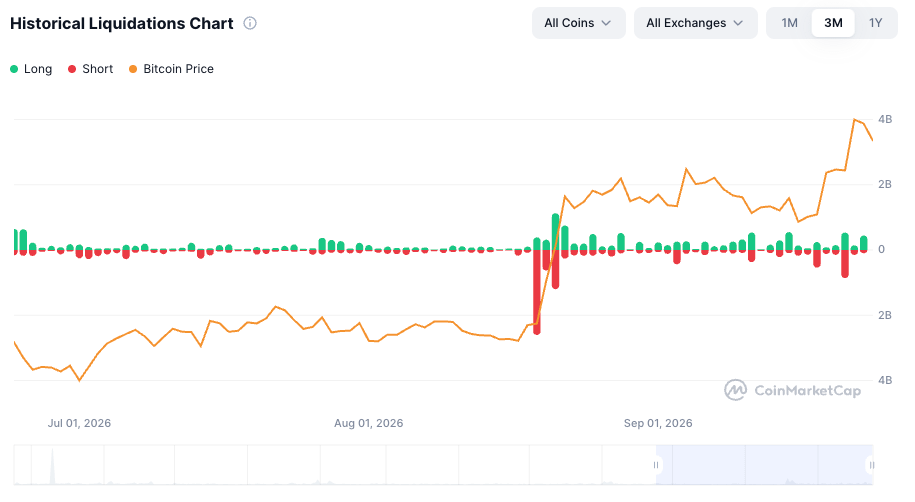
Figure 5: Bitcoin Liquidation Leverage Chart
Weekly Assessment
The market continued to strengthen during the week of September 21, with sentiment, price action, ETF demand, and derivatives positioning all reinforcing the recovery narrative.
Sentiment held in the Greed zone at 73, signalling that confidence is now trending and sustained rather than a reflexive bounce. BTC price action confirmed this, recovering from ~$77.5K to ~$84.22K and probing the $85K zone with a local high near $87.5K — a move characterized by higher lows and improving momentum.
ETF flows provided the clearest institutional signal this phase, with roughly +$1.5B into BTC ETFs, and constructive contributions from ETH, SOL, XRP, and HYPE. This represents a meaningful upgrade from the selective demand seen earlier in September.
On derivatives, a short liquidation squeeze reinforced the move higher, while the earlier long-liquidation wave has largely cleared. The key structural caveat remains that long leverage is heavier than short leverage, which supports upside momentum but leaves the market more vulnerable to sharp reversals.
Overall, the recovery is broadening across sentiment, price, institutional flows, and derivatives. Confidence is rebuilding, price is confirming, and institutional demand is returning at scale. The key question now is sustainability: whether multi-week ETF inflows, stable price action above the mid-$80Ks, and a balanced leverage structure can convert this renewed optimism into a durable, higher-level base.
Why trade OTC?
Binance offers our clients various ways to access OTC trading, including chat communication channels and the Binance OTC platform (https://www.binance.com/en/otc) for manual price quotations and execution services.
Email: trading@binance.com for more information.
Join our Telegram Channel @BinanceOTCTrading (https://t.me/+0mkJQnbQiOdlZjk0) to stay up to date with the markets!
You can also reach out to us on Telegram (@Binance_OTC_Desk) to connect directly with our experienced traders for your OTC trading needs. We look forward to assisting you and providing exceptional service for all your OTC transactions.