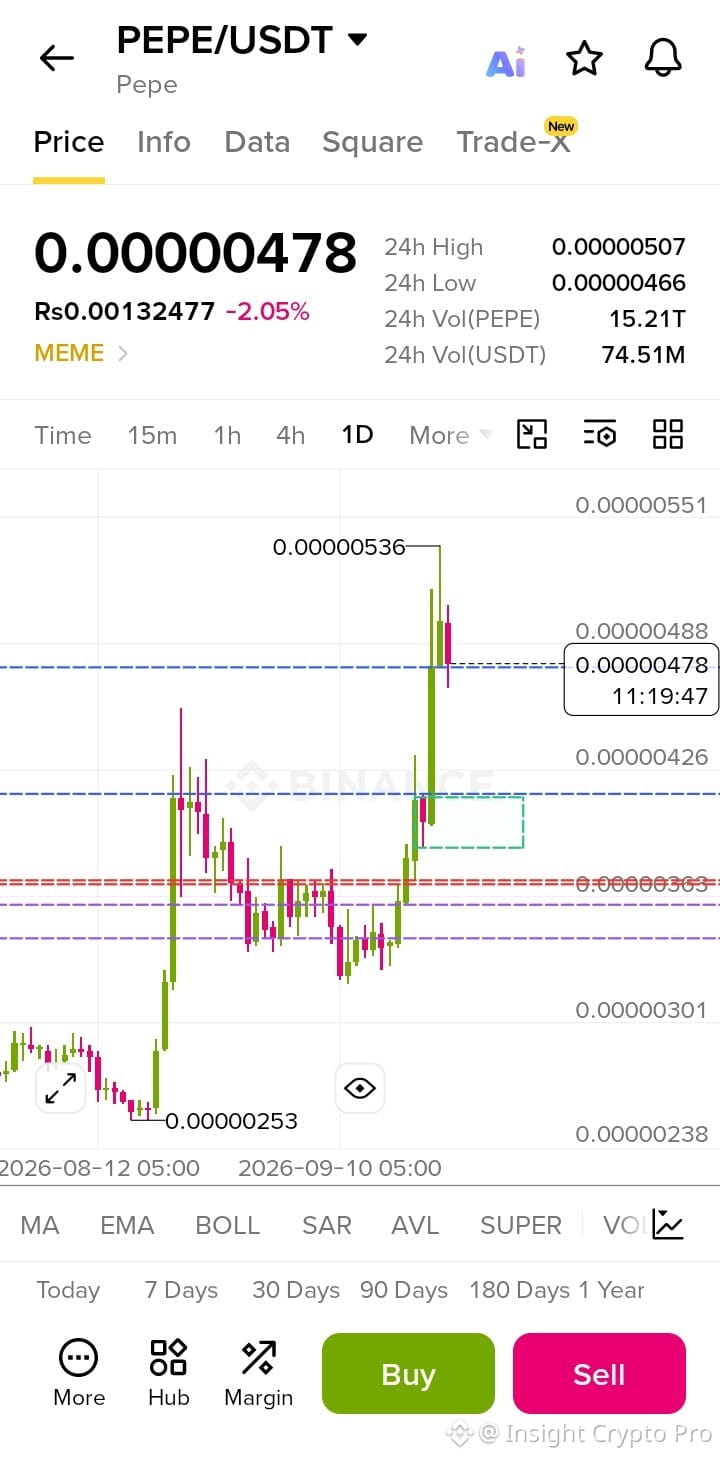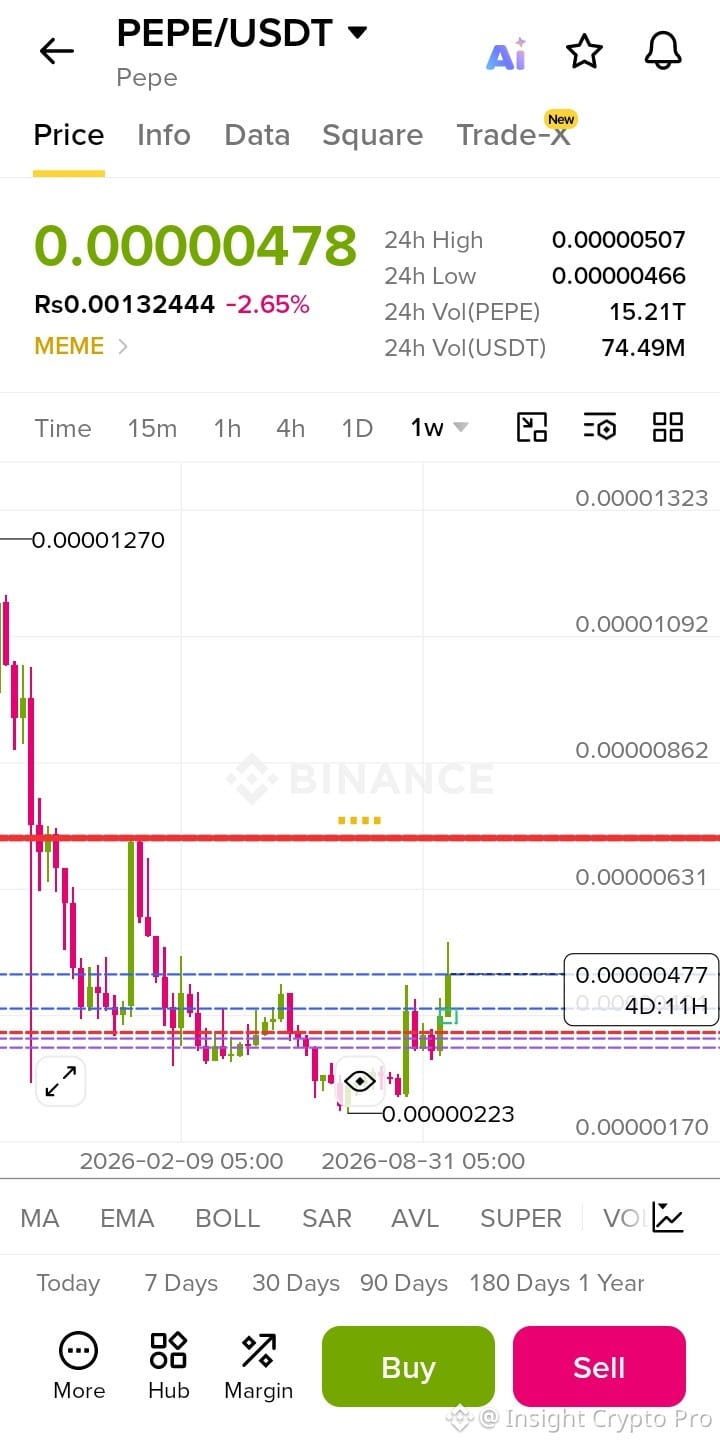
Daily, Weekly 📉📈 Chart Analysis
🐸 PEPE/USDT: Is This Red Line the Next Major Target?
PEPE is currently trading around the $0.000005 zone, and the next 2–3 months could be very interesting.
📊 PEPE/USDT Technical Roadmap:
🔹 $0.00000500–$0.00000510 → Immediate resistance
🔹 $0.00000535–$0.00000550 → First major breakout zone
🔹 $0.00000600 → Next resistance / liquidity area
🔴 $0.00000630–$0.00000650 → Major red-line zone
From the current ~$0.0000049 area, a move toward $0.0000064 would be roughly +30%.
For a 2–3 month timeframe, this move is technically possible if PEPE maintains higher lows and successfully flips the $0.000005–$0.0000055 region into support.
🎯 My chart levels:
5.0K → 5.5K → 6.0K → 🔴 6.3–6.5K
⚠️ Risk:
If PEPE loses the ~$0.00000450 area with sustained selling pressure, the bullish structure could weaken and lower support zones may come into play.
No guarantee — this is simply a technical roadmap based on price structure, resistance and liquidity zones.
What do you think? 👀
Can PEPE reach $0.0000065 within the next 2–3 months?
#PEPE #PEPEUSDT #PEPECoin #Crypto #CryptoTrading #BinanceSquare #TechnicalAnalysis #Altcoins #MemeCoin #CryptoAnalysis