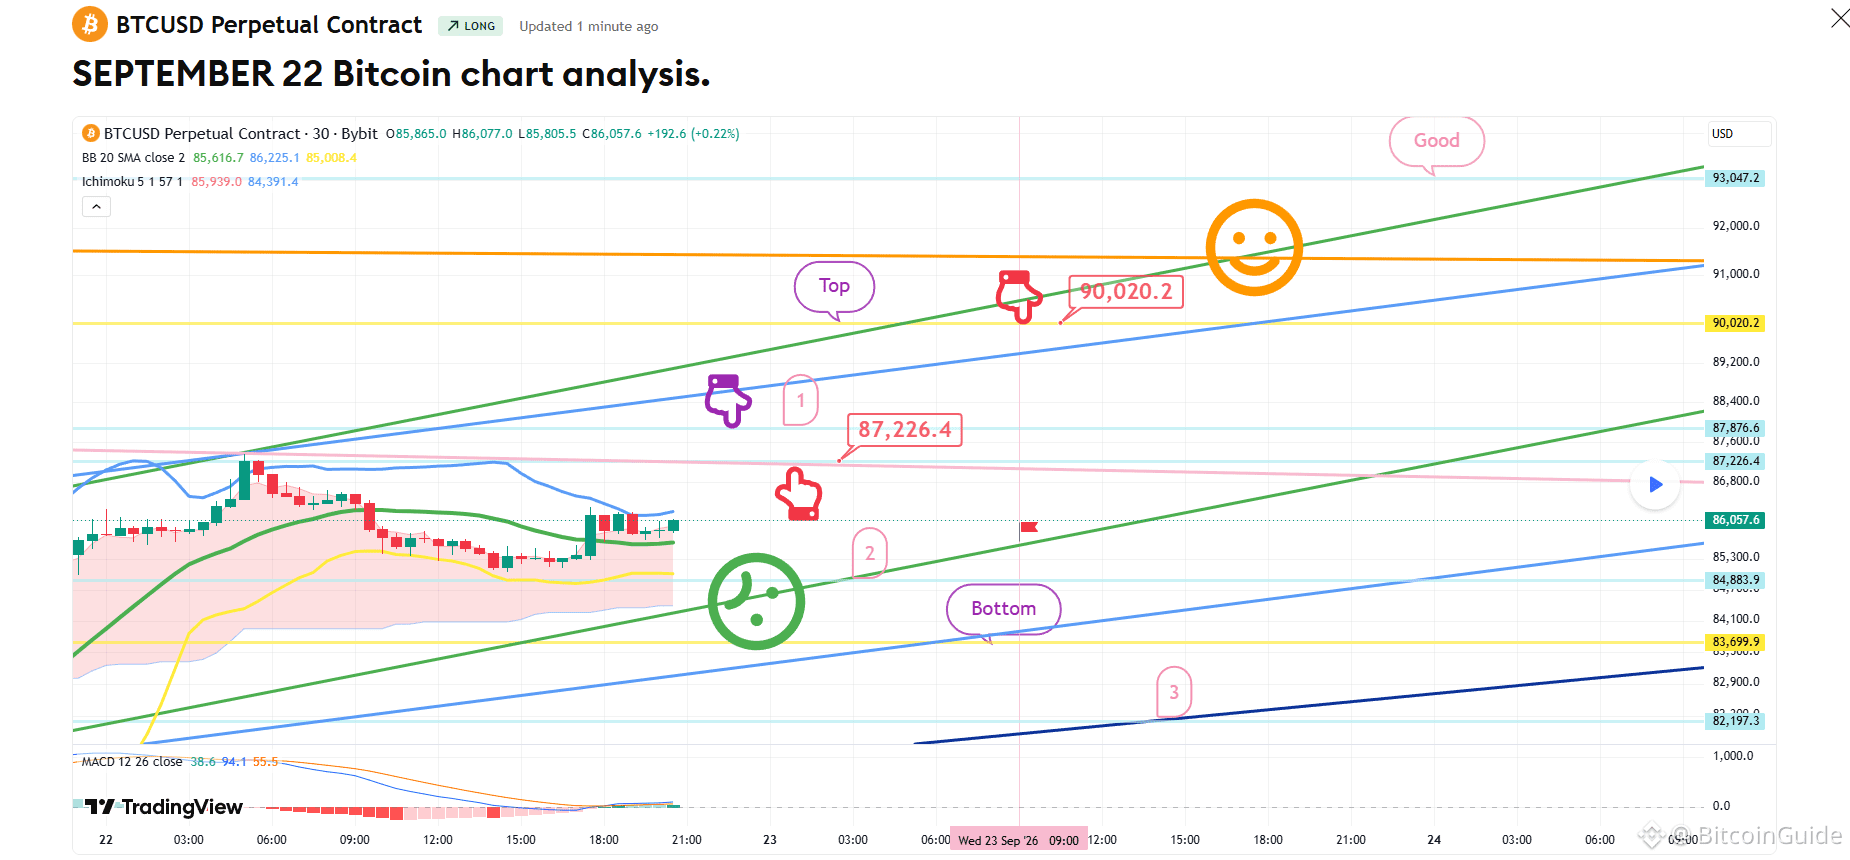
[September 23 Bitcoin chart analysis]
BTCUSD 30Min Chart
*My analysis is optimized for TradingView.
If you press the replay button, you can check real-time movements.
-Long position strategy-
This is the 30-minute Bitcoin chart.
While a correction is likely for the Nasdaq,
Bitcoin appears highly likely to move sideways at this level.
I have disregarded the MACD "death cross" on the 6-hour chart.
Also, I am interpreting the monthly chart as not having touched the middle line of the Bollinger Bands.
*If the price follows the path indicated by the red arrow:
Long position strategy
1) Long entry zone: $85,871.9 / Stop-loss level: If the purple support line is breached
2) Long position 1st target: $87,876.6 -> 2nd target: Top zone
The $87,114.4 level is a zone to consider for re-entering a long position.
Even if the price drops after a period of sideways movement, the bullish pattern remains intact,
so the area down to the "Bottom" level is considered a safe zone.
If the purple support line is breached,
please be aware that the price could drop to the "Bottom" level marked below,
then to level 1, and potentially as low as $83,699.9 by the weekend.
South Korea observes the Chuseok (Mid-Autumn Festival) holiday from tomorrow until the 27th.
I’ll take a good rest over the weekend and return next Monday.
I post the analysis results as a Comment every day.
Thank you.
(You can find the link on my profile.)
- Click Follow to receive faster information every day.
- Check the results using the replay button on TradingView.
#Bitcoin #BTC100K #Crypto #Altcoin Season# #BTC Price Analysis# $ETH $USDT $BTC $BNB $XRP
BTCUSD 30Min Chart
*My analysis is optimized for TradingView.
If you press the replay button, you can check real-time movements.
-Long position strategy-
This is the 30-minute Bitcoin chart.
While a correction is likely for the Nasdaq,
Bitcoin appears highly likely to move sideways at this level.
I have disregarded the MACD "death cross" on the 6-hour chart.
Also, I am interpreting the monthly chart as not having touched the middle line of the Bollinger Bands.
*If the price follows the path indicated by the red arrow:
Long position strategy
1) Long entry zone: $85,871.9 / Stop-loss level: If the purple support line is breached
2) Long position 1st target: $87,876.6 -> 2nd target: Top zone
The $87,114.4 level is a zone to consider for re-entering a long position.
Even if the price drops after a period of sideways movement, the bullish pattern remains intact,
so the area down to the "Bottom" level is considered a safe zone.
If the purple support line is breached,
please be aware that the price could drop to the "Bottom" level marked below,
then to level 1, and potentially as low as $83,699.9 by the weekend.
South Korea observes the Chuseok (Mid-Autumn Festival) holiday from tomorrow until the 27th.
I’ll take a good rest over the weekend and return next Monday.
I post the analysis results as a Comment every day.
Thank you.
(You can find the link on my profile.)
- Click Follow to receive faster information every day.
- Check the results using the replay button on TradingView.
#Bitcoin #BTC100K #Crypto #Altcoin Season# #BTC Price Analysis# $ETH $USDT $BTC $BNB $XRP