$ STOP TRADING BLINDLY: Master the RSI Indicator in 2 Minutes! 📈📉
If you are buying at the top and selling at the bottom, you are likely ignoring the Relative Strength Index (RSI).
The RSI is a momentum indicator that measures the speed and change of price movements on a scale from 0 to 100. Here is how smart traders use it to spot reversals before they happen!
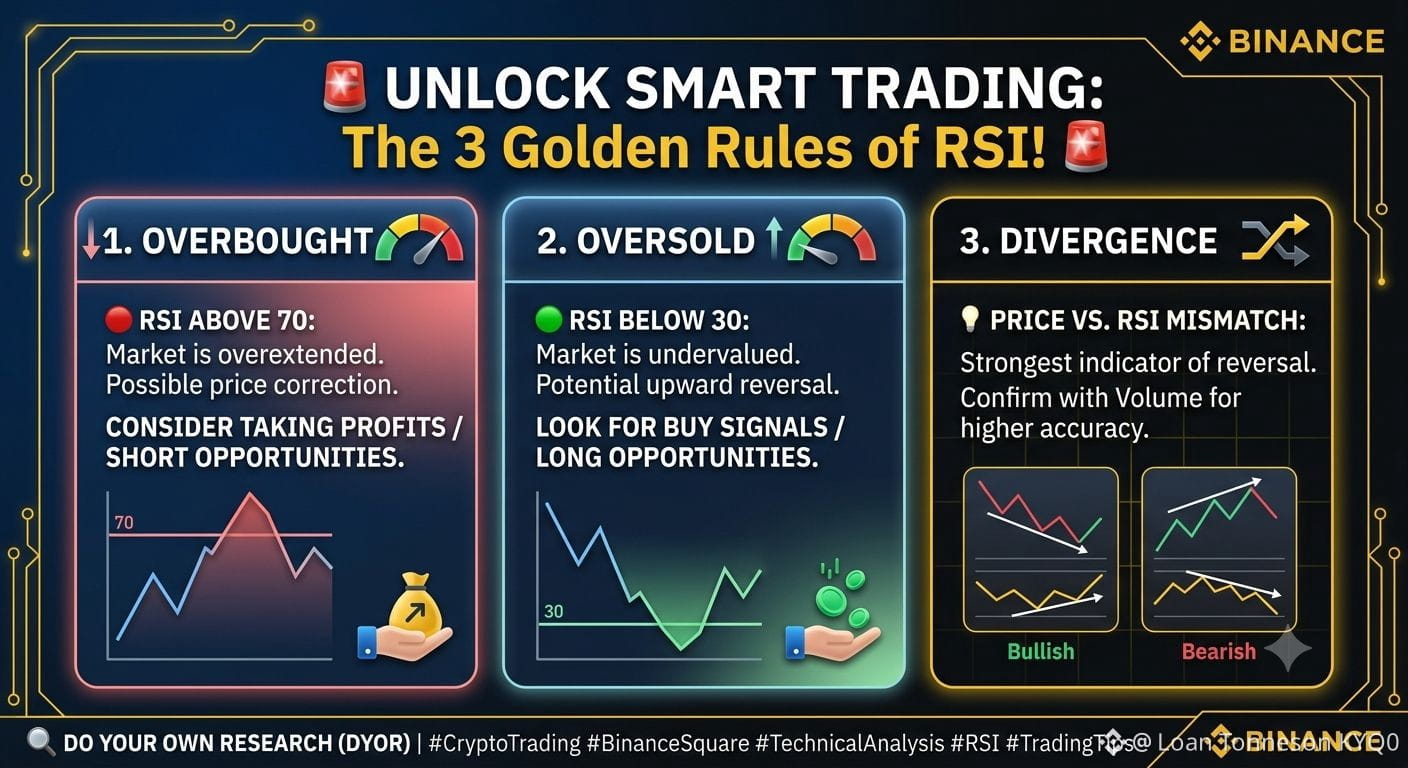
📊 The 3 Golden Rules of RSI Trading
RSI LevelMarket ConditionAction to Take
Below 30Oversold 🟢Price is undervalued. Look for BUY / Long opportunities.
30 to 70Neutral Zone ⚪Market is consolidating. Wait for clear breakout patterns.
Above 70Overbought 🔴Price is overextended. Consider taking profits or looking for SELL / Short setups.
💡 Pro-Tip: Watch Out for RSI Divergence
Bullish Divergence: Price makes a Lower Low, but RSI makes a Higher Low. This signals a strong potential Upward Reversal.
Bearish Divergence: Price makes a Higher High, but RSI makes a Lower High. This signals a potential Downward Reversal.
⚠️ Rule of Thumb: Never use RSI alone! Combine it with Support & Resistance levels and volume confirmation for higher accuracy.
👇 Quick Question: What timeframe do you prefer when using RSI — 15m, 1H, or 4H? Drop your answer in the comments below!
#CryptoTrading #BinanceSquare #TechnicalAnalysis #RSI #TradingTips #DYOR $BNB $BTC $ETH
If you are buying at the top and selling at the bottom, you are likely ignoring the Relative Strength Index (RSI).
The RSI is a momentum indicator that measures the speed and change of price movements on a scale from 0 to 100. Here is how smart traders use it to spot reversals before they happen!
📊 The 3 Golden Rules of RSI Trading
RSI LevelMarket ConditionAction to Take
Below 30Oversold 🟢Price is undervalued. Look for BUY / Long opportunities.
30 to 70Neutral Zone ⚪Market is consolidating. Wait for clear breakout patterns.
Above 70Overbought 🔴Price is overextended. Consider taking profits or looking for SELL / Short setups.
💡 Pro-Tip: Watch Out for RSI Divergence
Bullish Divergence: Price makes a Lower Low, but RSI makes a Higher Low. This signals a strong potential Upward Reversal.
Bearish Divergence: Price makes a Higher High, but RSI makes a Lower High. This signals a potential Downward Reversal.
⚠️ Rule of Thumb: Never use RSI alone! Combine it with Support & Resistance levels and volume confirmation for higher accuracy.
👇 Quick Question: What timeframe do you prefer when using RSI — 15m, 1H, or 4H? Drop your answer in the comments below!
#CryptoTrading #BinanceSquare #TechnicalAnalysis #RSI #TradingTips #DYOR $BNB $BTC $ETH