#BTC Liquidation Map: The Bigger Liquidity Pool Is Above
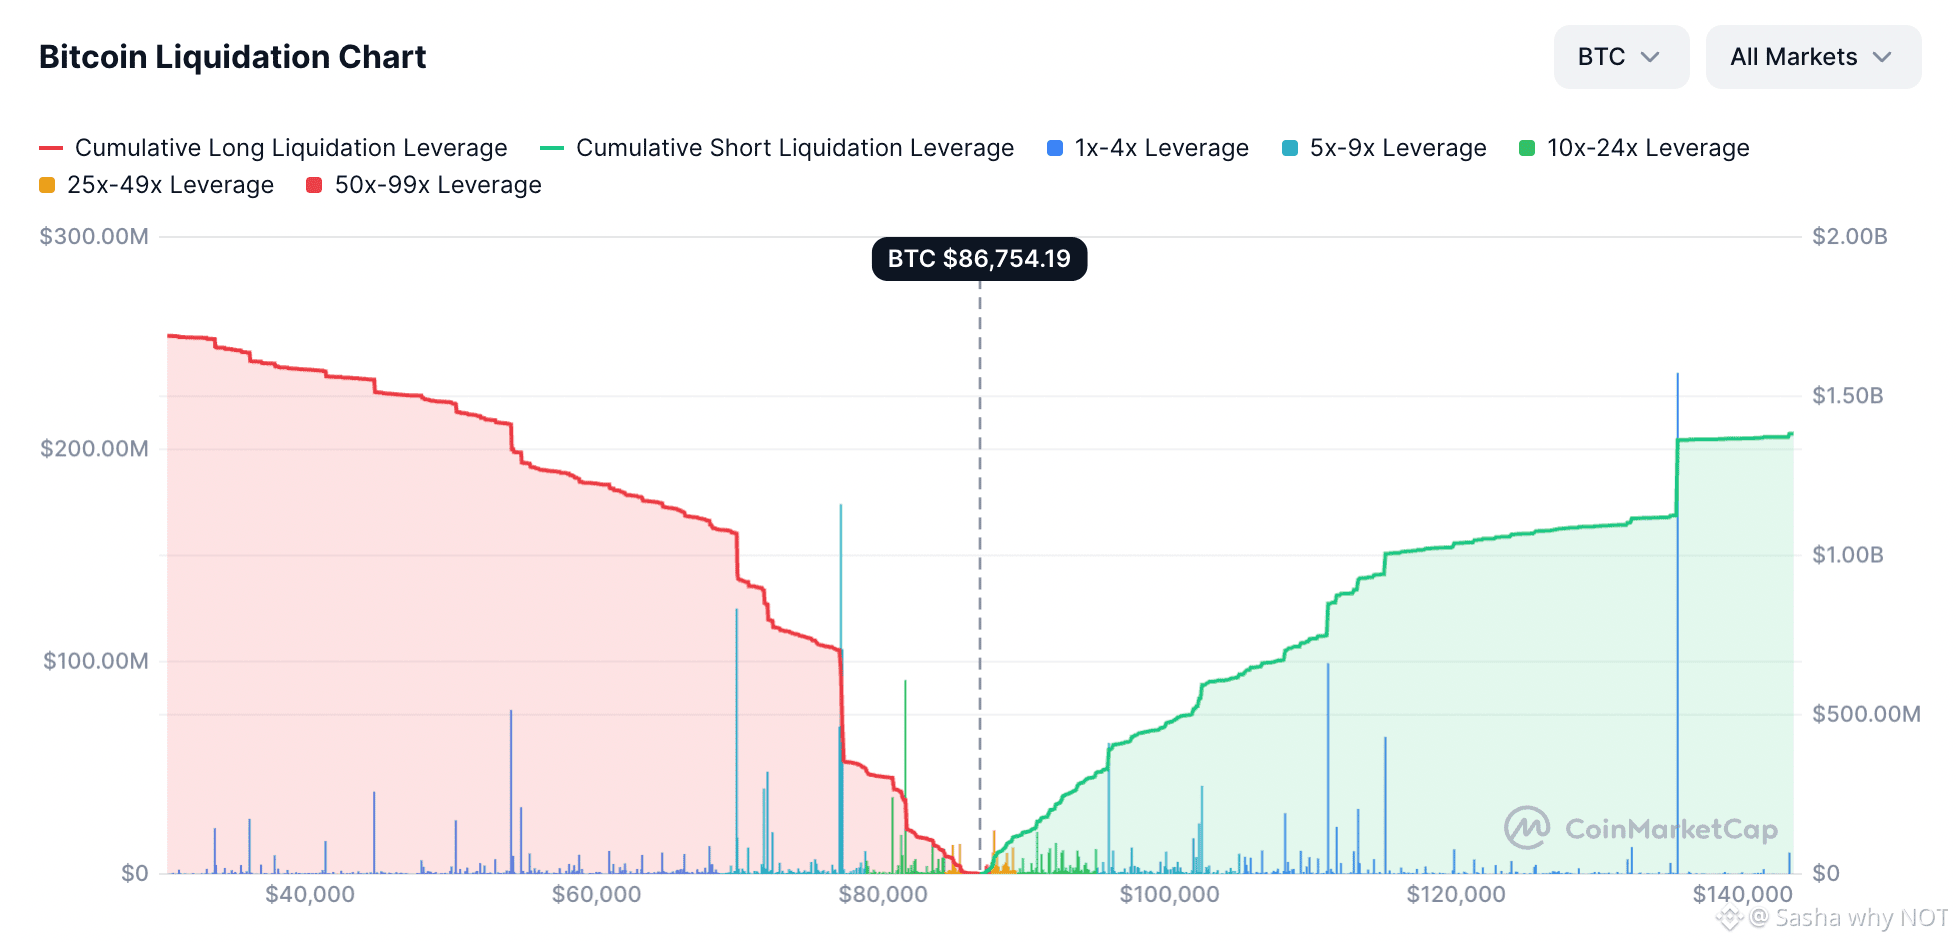
Bitcoin is trading around $86.8K, and the liquidation map shows a clear imbalance.
Above the current price, cumulative short liquidation leverage builds aggressively, reaching roughly $1.4B toward the $140K area.
Below BTC long liquidations are also significant, but the largest clusters sit further away.
The key takeaway: there is currently more potential liquidation liquidity above BTC than below it.
That doesn’t mean #bitcoin has to move higher — liquidation maps are not price forecasts. But if BTC continues to climb, forced short liquidations could amplify the move.
Liquidity is building above. Now the question is whether price goes looking for it.
Bitcoin is trading around $86.8K, and the liquidation map shows a clear imbalance.
Above the current price, cumulative short liquidation leverage builds aggressively, reaching roughly $1.4B toward the $140K area.
Below BTC long liquidations are also significant, but the largest clusters sit further away.
The key takeaway: there is currently more potential liquidation liquidity above BTC than below it.
That doesn’t mean #bitcoin has to move higher — liquidation maps are not price forecasts. But if BTC continues to climb, forced short liquidations could amplify the move.
Liquidity is building above. Now the question is whether price goes looking for it.