



A daily golden-cross setup is nearing confirmation, but the moving averages still require a decisive crossover before validation now.
Derivatives activity remains elevated, with Binance leading open interest, volume and trade counts across the latest market snapshot.
Price fell from the $1.44–$1.45 area toward $1.36, leaving $1.40–$1.42 as resistance and $1.36 as immediate support zone nearby now.
XRP is testing a crucial technical phase as fading momentum, heavy derivatives activity, and moving-average convergence shape the market’s next move after a volatile recovery across the latest session.
Golden Cross Setup Remains Under Scrutiny
FinanceBro’s post describes the golden cross as already forming on the daily chart. The accompanying setup, however, shows moving averages tightening around recent price action. That distinction matters because convergence does not confirm a completed crossover.
https://twitter.com/FinanceBroYT/status/2101519501623779670?s=20
A golden cross is when the 50-day moving average moves above the 200-day moving average.Those averages have been converging since a quick recovery period, as depicted in the chart. Price then entered consolidation rather than extending immediately toward fresh highs.
The recovery began with a strong upward candle and elevated trading activity. Volume later moderated as alternating candles formed around the moving-average cluster. That pattern leaves the market waiting for clearer directional confirmation.
Recent commentary places the daily crossover near completion rather than fully confirmed. The shorter average remained below the longer average in the latest referenced assessment. Therefore, the technical signal still depends on the averages crossing decisively.
Futures Activity Adds Another Layer
The latest market data places the current price around $1.37. The token is down 2.44% over 24 hours, while volume reaches $3.32 billion. That volume remains substantial despite activity falling 29.69% during the period.
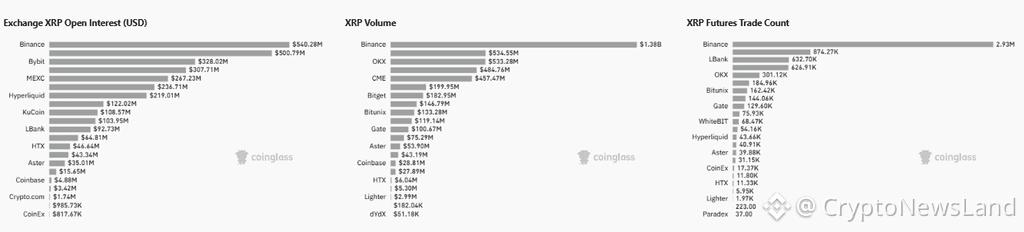 Source: Coinglass
The derivatives data shows Binance leading open interest at $540.28 million. Another exchange follows with about $500.79 million, while Bybit holds $328.02 million. Several additional venues maintain positions above $200 million.
Binance also records roughly $1.38 billion in futures trading volume. Other major venues post volumes between approximately $457 million and $534 million. CME contributes about $457.47 million, adding another major derivatives venue.
Trade counts reinforce the scale of activity across the derivatives market. Binance records approximately 2.93 million futures trades during the displayed period. The next exchange records about 874,270 trades, leaving a wide activity gap.
Price Structure Faces Important Levels
The intraday chart shows an early advance toward the $1.44–$1.45 area. That move later lost momentum as sellers pushed price beneath $1.413. The decline then developed into a sequence of lower highs and lower lows.
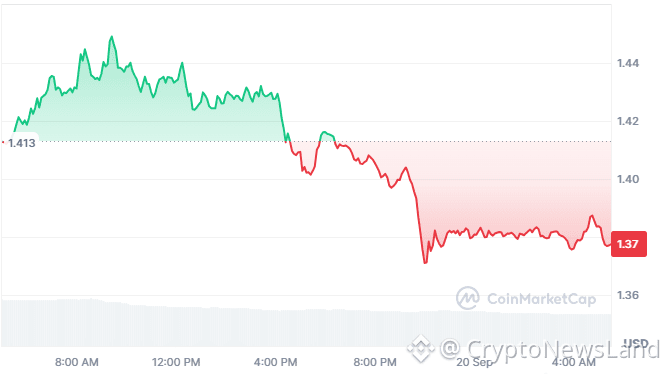 Source: Coinmarketcap
Selling intensified during the later session, sending price toward approximately $1.36. A rebound followed, but recovery stalled around the $1.37–$1.38 region. That area is now important for determining whether consolidation can stabilize.
The $1.40 level represents the first psychological resistance during any recovery attempt. The $1.41–$1.42 region could provide stronger resistance above that threshold. Meanwhile, $1.36 remains the immediate support after the sharp decline.
The broader setup therefore combines technical convergence with elevated derivatives participation. Neither open interest nor volume identifies whether traders hold predominantly long positions. The next move will depend on price behavior around resistance, support, and moving averages.