$1000BONK , THIS COULD GET INTERESTING.
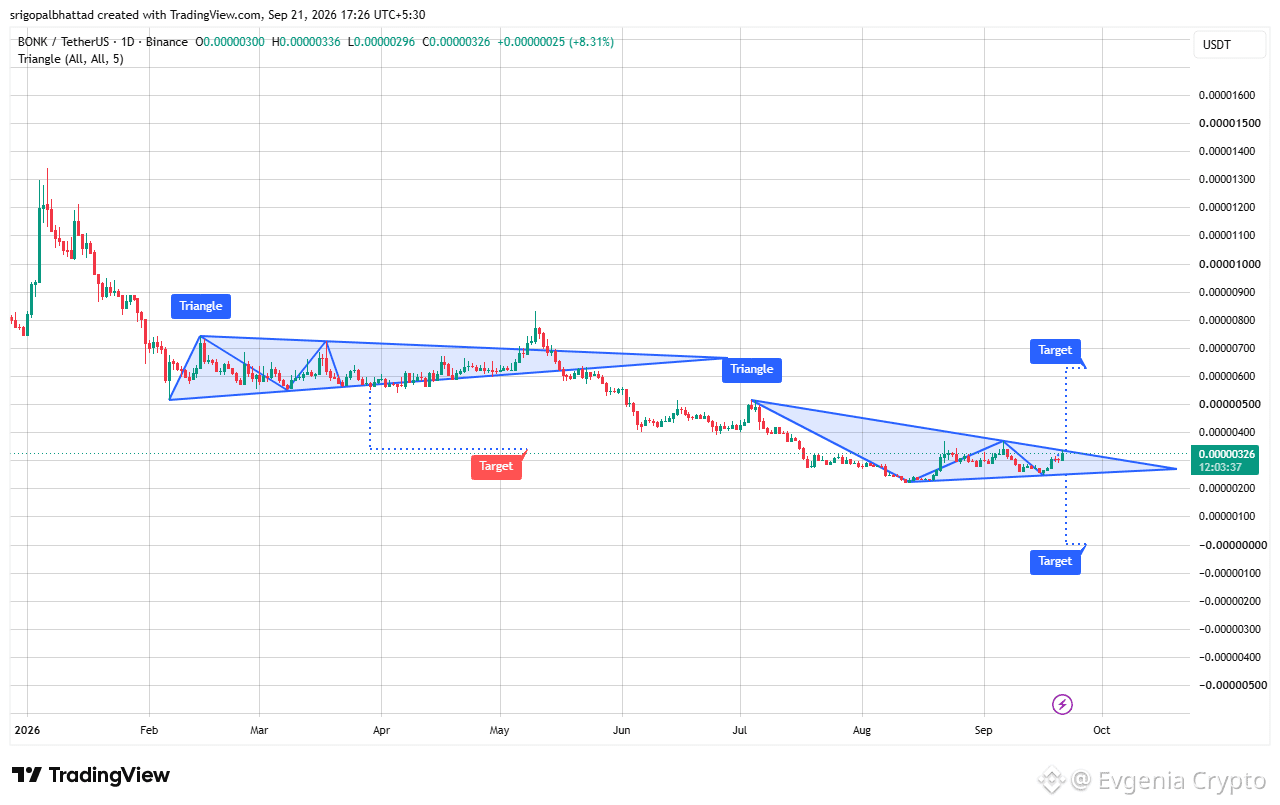
After a prolonged decline, price is forming a triangle on the daily chart and is currently trading around $0.000000326.
Sellers are waiting around the $0.00000040–0.00000050 resistance zone.
But the key level for me is $0.00000040.
If $BONK breaks above it and holds, the chart target is around $0.00000065.
However, if the lower boundary of the triangle fails, this setup starts to weaken.
Support: $0.00000024–0.00000026.
I wouldn’t rush to make a call yet. First, I want to see which direction the market actually chooses.
$BONK looks like it could be getting close to the end of a long compression.
After a prolonged decline, price is forming a triangle on the daily chart and is currently trading around $0.000000326.
Sellers are waiting around the $0.00000040–0.00000050 resistance zone.
But the key level for me is $0.00000040.
If $BONK breaks above it and holds, the chart target is around $0.00000065.
However, if the lower boundary of the triangle fails, this setup starts to weaken.
Support: $0.00000024–0.00000026.
I wouldn’t rush to make a call yet. First, I want to see which direction the market actually chooses.
$BONK looks like it could be getting close to the end of a long compression.