
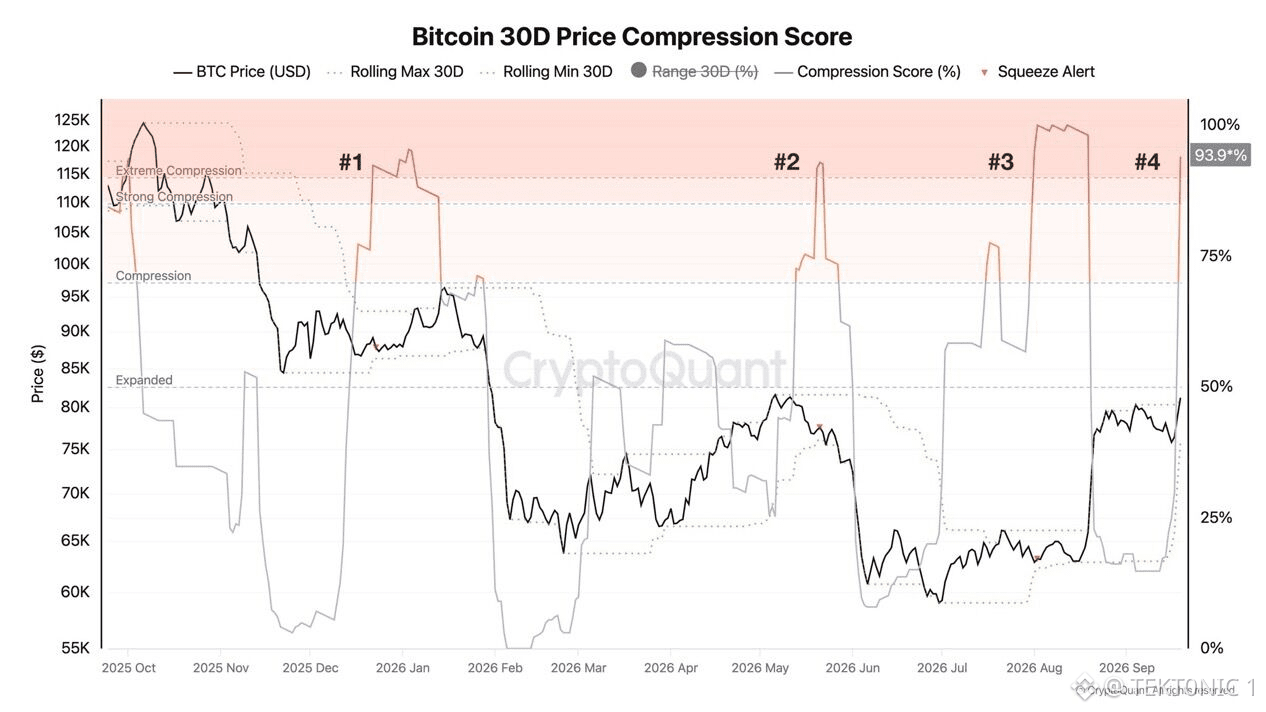
bitcoin’s 30-day compression score just hit 93.9%, which puts it back in the extreme zone. that score measures how tight the last 30 days have been. a high number means price has been stuck in a small range. CryptoQuant analyst Axel Adler Jr. says this coil is sitting against the yearly moving average, and the chart marks it as the fourth extreme after January, May and August. tight ranges often lead to a larger move. they do not tell you the direction. $BTC August’s extreme came before the drop toward $75,600 and the bounce back through $81,000. $82,000 is still the weekly ceiling. $76,800 is the level that failed on the way down. those two prices are the map once this range opens. the catch is simple. 93.9% means the range is tight, not that $BTC must rally, and the yearly average can hold or break when volatility returns. so bitcoin is coiled. the next decisive week is the setup. $82,000 and $76,800 still decide it. #Bitcoin Price Prediction: What is Bitcoins next move?# #BTC Price Analysis# $XRP

Publier
Avertissement : ce contenu inclut des opinions de tiers. Il ne constitue pas un conseil. Binance Ai peut être utilisée, sans garantie de résultat. Consultez les CG.