🚀 $ZEC /USDT TECHNICAL ANALYSIS — BULLISH STRUCTURE UNDER PRESSURE
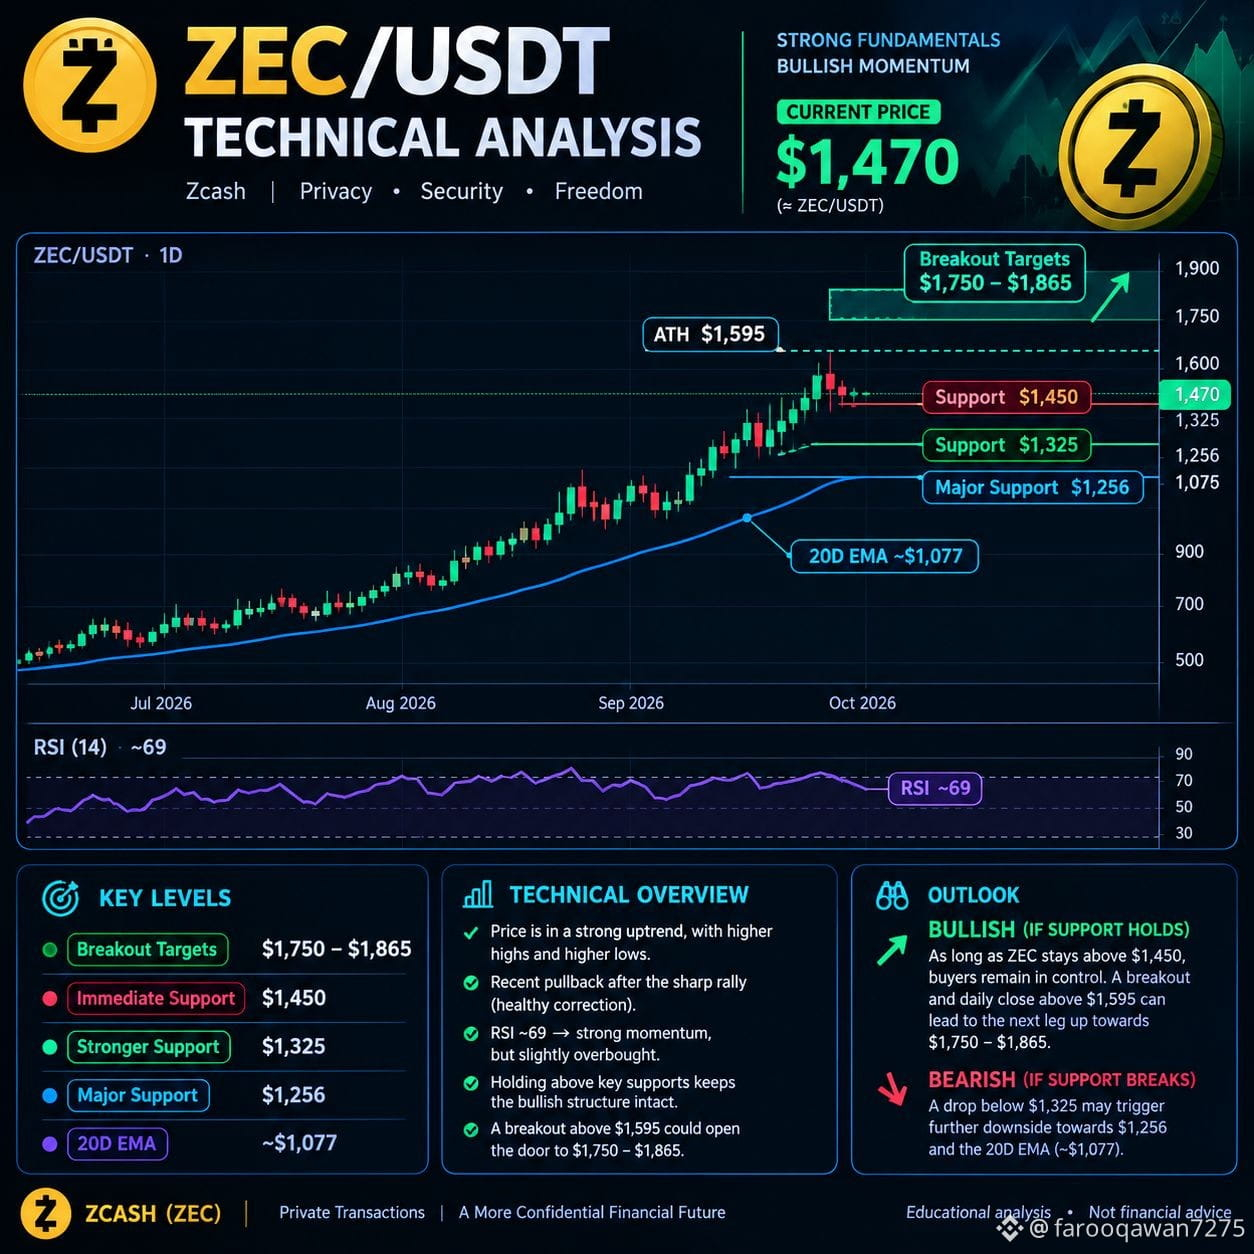
Zcash ($ZEC ) is currently trading around $1,470, following a sharp pullback from its recent $1,595 all-time high.
📊 Market Structure
• Strong higher-high / higher-low structure
• Price remains well above the 20D EMA (~$1,077)
• Momentum remains strong, but volatility is extremely high
• RSI (14) ≈ 69, approaching the overbought zone
🎯 KEY LEVELS
🟢 Immediate Support: $1,450
🟢 Strong Support: $1,325
🔵 Major Support: $1,256
🔵 20D EMA: ~$1,077
🔴 Major Resistance / ATH: $1,595
🚀 Bullish Scenario
If ZEC holds the $1,450–$1,325 support region and buyers reclaim $1,595 with strong volume, the next technical upside zone could be:
➡️ $1,750 – $1,865
⚠️ Bearish Scenario
A decisive breakdown below $1,325 could weaken the short-term structure and expose:
➡️ $1,256
➡️ ~$1,077 (20D EMA)
📌 Trader's Takeaway
ZEC remains in a powerful uptrend, but after such an explosive rally, pullbacks and high volatility are normal. The key question now is whether buyers can defend support and eventually reclaim the $1,595 ATH.
🔥 Watch $1,450 / $1,325 on the downside and $1,595 on the upside.
Educational technical analysis only — not financial advice.
#ZEC #Zcash #Crypto #BinanceSquare #TechnicalAnalysis #Trading #Altcoins
Zcash ($ZEC ) is currently trading around $1,470, following a sharp pullback from its recent $1,595 all-time high.
📊 Market Structure
• Strong higher-high / higher-low structure
• Price remains well above the 20D EMA (~$1,077)
• Momentum remains strong, but volatility is extremely high
• RSI (14) ≈ 69, approaching the overbought zone
🎯 KEY LEVELS
🟢 Immediate Support: $1,450
🟢 Strong Support: $1,325
🔵 Major Support: $1,256
🔵 20D EMA: ~$1,077
🔴 Major Resistance / ATH: $1,595
🚀 Bullish Scenario
If ZEC holds the $1,450–$1,325 support region and buyers reclaim $1,595 with strong volume, the next technical upside zone could be:
➡️ $1,750 – $1,865
⚠️ Bearish Scenario
A decisive breakdown below $1,325 could weaken the short-term structure and expose:
➡️ $1,256
➡️ ~$1,077 (20D EMA)
📌 Trader's Takeaway
ZEC remains in a powerful uptrend, but after such an explosive rally, pullbacks and high volatility are normal. The key question now is whether buyers can defend support and eventually reclaim the $1,595 ATH.
🔥 Watch $1,450 / $1,325 on the downside and $1,595 on the upside.
Educational technical analysis only — not financial advice.
#ZEC #Zcash #Crypto #BinanceSquare #TechnicalAnalysis #Trading #Altcoins