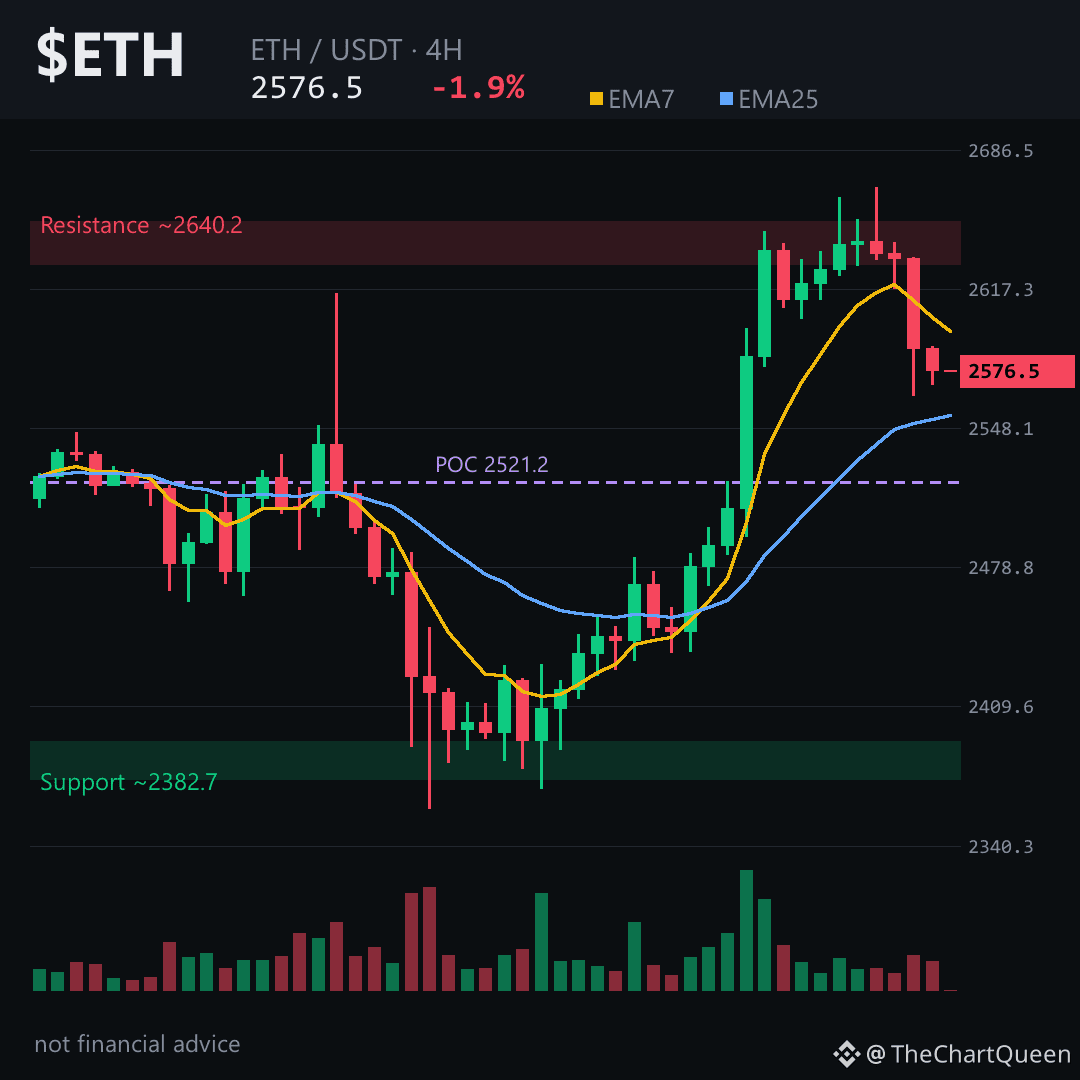
Hard truth: $ETH just gave back the entire breakout in under twelve hours. That 2668 print on the 16:00 candle wasn't a launch — it was a liquidity grab before the rug back to 2564.
That drop filled a bearish gap around 2588-2617, meaning the move was mechanical, not emotional. The 4H structure never broke bullish — it just teased it.
Funding is barely positive, but the long/short ratio sits above 2. Too many hands leaning one way for a clean push higher. Open interest is thin. This looks like a market that needs to bleed out over-leveraged optimism before it can trend again.
The only timeframe I trust right now is the daily. The 4H is chop with a downtrend tilt, but daily EMA7 at 2540 is still above EMA25 at 2441. That's the spine of the bullish case. Price is hovering right above it, and the daily bullish gap from 2483 to 2602 is still unfilled on the bottom side. That zone is the magnet.
The level that matters is ~2485-2490. Lose that on a daily close and the whole bullish structure unwinds toward 2340. Hold it, and recovery toward 2685-2700 stays alive. Tap $ETH to pull the chart up and see how cleanly price is coiled against that daily gap.
My read: this is a daily timeframe story wearing a 4H panic costume. The real risk isn't the dip — it's mistaking this chop for a trend reversal when the higher timeframe hasn't flipped yet.
If this 2485 zone gets tested, I'll break down what the reaction tells us about the next leg. Follow so that read lands in your feed.
What level are you watching more closely — the gap fill down at 2485 or the recovery zone near 2685 on $ETH? 👇
⚠️ Not financial advice. DYOR.
#ETH #Ethereum #Crypto #BinanceSquare
That drop filled a bearish gap around 2588-2617, meaning the move was mechanical, not emotional. The 4H structure never broke bullish — it just teased it.
Funding is barely positive, but the long/short ratio sits above 2. Too many hands leaning one way for a clean push higher. Open interest is thin. This looks like a market that needs to bleed out over-leveraged optimism before it can trend again.
The only timeframe I trust right now is the daily. The 4H is chop with a downtrend tilt, but daily EMA7 at 2540 is still above EMA25 at 2441. That's the spine of the bullish case. Price is hovering right above it, and the daily bullish gap from 2483 to 2602 is still unfilled on the bottom side. That zone is the magnet.
The level that matters is ~2485-2490. Lose that on a daily close and the whole bullish structure unwinds toward 2340. Hold it, and recovery toward 2685-2700 stays alive. Tap $ETH to pull the chart up and see how cleanly price is coiled against that daily gap.
My read: this is a daily timeframe story wearing a 4H panic costume. The real risk isn't the dip — it's mistaking this chop for a trend reversal when the higher timeframe hasn't flipped yet.
If this 2485 zone gets tested, I'll break down what the reaction tells us about the next leg. Follow so that read lands in your feed.
What level are you watching more closely — the gap fill down at 2485 or the recovery zone near 2685 on $ETH? 👇
⚠️ Not financial advice. DYOR.
#ETH #Ethereum #Crypto #BinanceSquare