

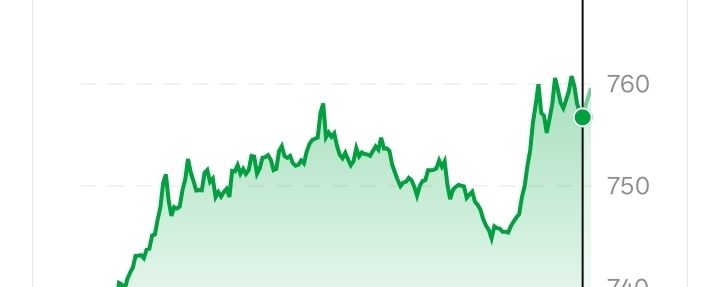

BNB Price Update — September 18, 2026
BNB is currently trading around the $760 area. Today's price has moved strongly upward, with an intraday high around $761 and a low around $725.
Recent market data shows BNB gaining around 4–5% over the previous session, while technical indicators are showing strong momentum.
But the important question is:
Can BNB continue higher, or will traders see a short-term pullback?
Let's break down the chart step by step. 👇
🕯️ 1. Understanding the Current BNB Candle
The recent BNB price action shows strong buying pressure.
A large bullish candle means buyers have pushed the price significantly higher during that candle's timeframe.
However, one bullish candle does not guarantee that the next candle will also be bullish.
For confirmation, traders should watch:
Candle + Volume + Support + Resistance + Momentum
A strong candle closing near its high can show buying strength.
A candle with a long upper wick near resistance can indicate that sellers are becoming active.
📊 2. Important Support Levels
Based on current technical levels, traders can watch the following areas:
🟢 $749–$750
This is an immediate short-term area around the current price structure.
🟢 $744–$747
This zone can become important if BNB experiences a small pullback.
🟢 $725–$730
Today's lower area provides a deeper short-term reference zone.
If price falls toward support and buyers defend the level with strong volume, the next bullish candle could become important.
Current technical data also places several short-term support levels around $749, $747 and $745.
🚀 3. Important Resistance Levels
The first major area traders are watching is:
🔴 $760–$761
BNB is currently testing this area.
A strong candle close above resistance, followed by a successful retest, would provide stronger evidence of a breakout.
Above that, traders may watch:
$770 → $780 → $800
These are potential psychological and technical areas to monitor, not guaranteed targets.
📈 4. Bullish Scenario
If BNB breaks above the current resistance zone and holds it as support, the market could start testing higher levels.
A possible technical sequence could be:
$760 → $770 → $780 → $800
For a stronger breakout, traders should ideally see:
✅ Strong candle close
✅ Increasing volume
✅ Successful retest
✅ Buyers defending the breakout level
A temporary move above $760 without confirmation could turn into a false breakout.
📉 5. Bearish Scenario
If BNB is rejected near $760 and sellers become stronger, the price could return toward the nearby support zones.
Possible areas to watch:
$750 → $745 → $730 → $725
A break below major support with strong selling volume would weaken the short-term structure.
This does not mean BNB must fall; these are levels to monitor if selling pressure increases.
📈 6. Moving Averages
Current technical data shows BNB trading above several important moving averages.
The 20-day, 50-day, 100-day and 200-day averages are positioned below the current market price in the latest technical snapshot.
That generally indicates that the broader technical structure remains constructive.
However, moving averages are lagging indicators. They confirm past price behavior rather than guaranteeing the next move.
📊 7. RSI — Is BNB Overbought?
RSI is an important momentum indicator.
Current technical readings put BNB's RSI around the upper range, with one source showing approximately 66.6 and another showing around 69.6 depending on the market/timeframe.
This means momentum is strong, but traders should also be alert to the possibility of a short-term cooling-off period.
Important:
Overbought does NOT automatically mean SELL.
A strong asset can remain overbought while continuing to rise.
📊 8. MACD
MACD is currently showing a positive signal in the latest technical data.
This supports the idea that recent momentum has been positive.
However, traders should watch whether the MACD continues to expand positively or starts turning down.
A bearish MACD crossover combined with a break of support would provide a different technical picture.
📦 9. Volume
Volume is one of the most important confirmations for a breakout.
A breakout with strong volume is generally more convincing than a breakout occurring on weak volume.
Watch for:
Price ↑ + Volume ↑ = stronger breakout confirmation
while:
Price ↑ + Volume ↓ = greater need for caution
🕯️ 10. Candlestick Patterns to Watch
Bullish Engulfing
A large bullish candle covers the previous bearish candle.
This can indicate increasing buying pressure.
Bearish Engulfing
A large bearish candle covers the previous bullish candle.
This can indicate increasing selling pressure.
Doji
A small body with significant wicks can indicate indecision.
Hammer
A long lower wick after a decline can indicate that buyers rejected lower prices.
Shooting Star
A long upper wick after an advance can indicate rejection from higher prices.
Marubozu
A candle with very little wick can indicate strong directional movement.
Recent BNB technical data has identified patterns including Marubozu and long-line candles on certain timeframes, while other shorter timeframes show mixed candle patterns.
The timeframe matters: a 5-minute candle and a daily candle do not carry the same significance.
⏰ 11. Timeframes Matter
Before interpreting a candle, always check its timeframe.
5-minute: Very short-term noise
15-minute: Short-term momentum
1-hour: Intraday structure
4-hour: Short/medium-term trend
Daily: Much stronger overall market signal
Weekly: Long-term market structure
A bullish 5-minute candle does not automatically mean the daily trend has changed.
🔮 12. BNB Price Outlook
Rather than claiming one guaranteed price prediction, there are several possible scenarios.
🟢 Bullish Scenario
BNB breaks above $760–$761, closes strongly, and successfully retests the breakout.
Possible areas to watch:
$770 → $780 → $800
🟡 Sideways Scenario
BNB remains between approximately $745 and $761, creating consolidation.
This could mean buyers and sellers are fighting for control before the next major move.
🔴 Bearish Scenario
BNB gets rejected near resistance and loses $745–$750.
Then traders may watch:
$730 → $725
A decisive break below support could increase downside pressure.
🧠 13. What Could Affect BNB?
BNB's price can be affected by many factors, including:
• Overall crypto market direction
• Bitcoin price movement
• Binance ecosystem activity
• BNB Chain usage
• Market liquidity
• Trading volume
• Regulatory developments
• Crypto investor sentiment
• Broader economic conditions
• Major market news
BNB's ecosystem developments and institutional adoption have recently been cited among factors supporting demand, although short-term technical conditions remain important.
⚠️ 14. Risk Management
Never buy simply because a candle is green.
Before entering a trade, consider:
✅ Entry price
✅ Stop-loss level
✅ Take-profit levels
✅ Position size
✅ Trading fees
✅ Market volatility
✅ Your own risk tolerance
Do not invest money you cannot afford to lose.
🎯 Final BNB Analysis
BNB is currently showing strong short-term momentum, with price around the $760 region.
The most important area right now is approximately:
$760–$761 resistance
For bulls, a confirmed breakout and successful retest could open the way toward higher levels such as $770, $780 and $800.
For bears, rejection followed by a loss of $745–$750 would bring lower support areas into focus.
The candle alone cannot predict the future.
Watch the candle.
Watch the volume.
Watch support and resistance.
Manage your risk.
#BNB #BNBAnalysis #Binance #Crypto #CryptoTrading #BNBUSDT #TechnicalAnalysis #Candlestick #BNBPrice #Altcoins #BinanceCoin
Educational content only. This is not financial advice. Crypto prices are highly volatile, and technical levels can change quickly.