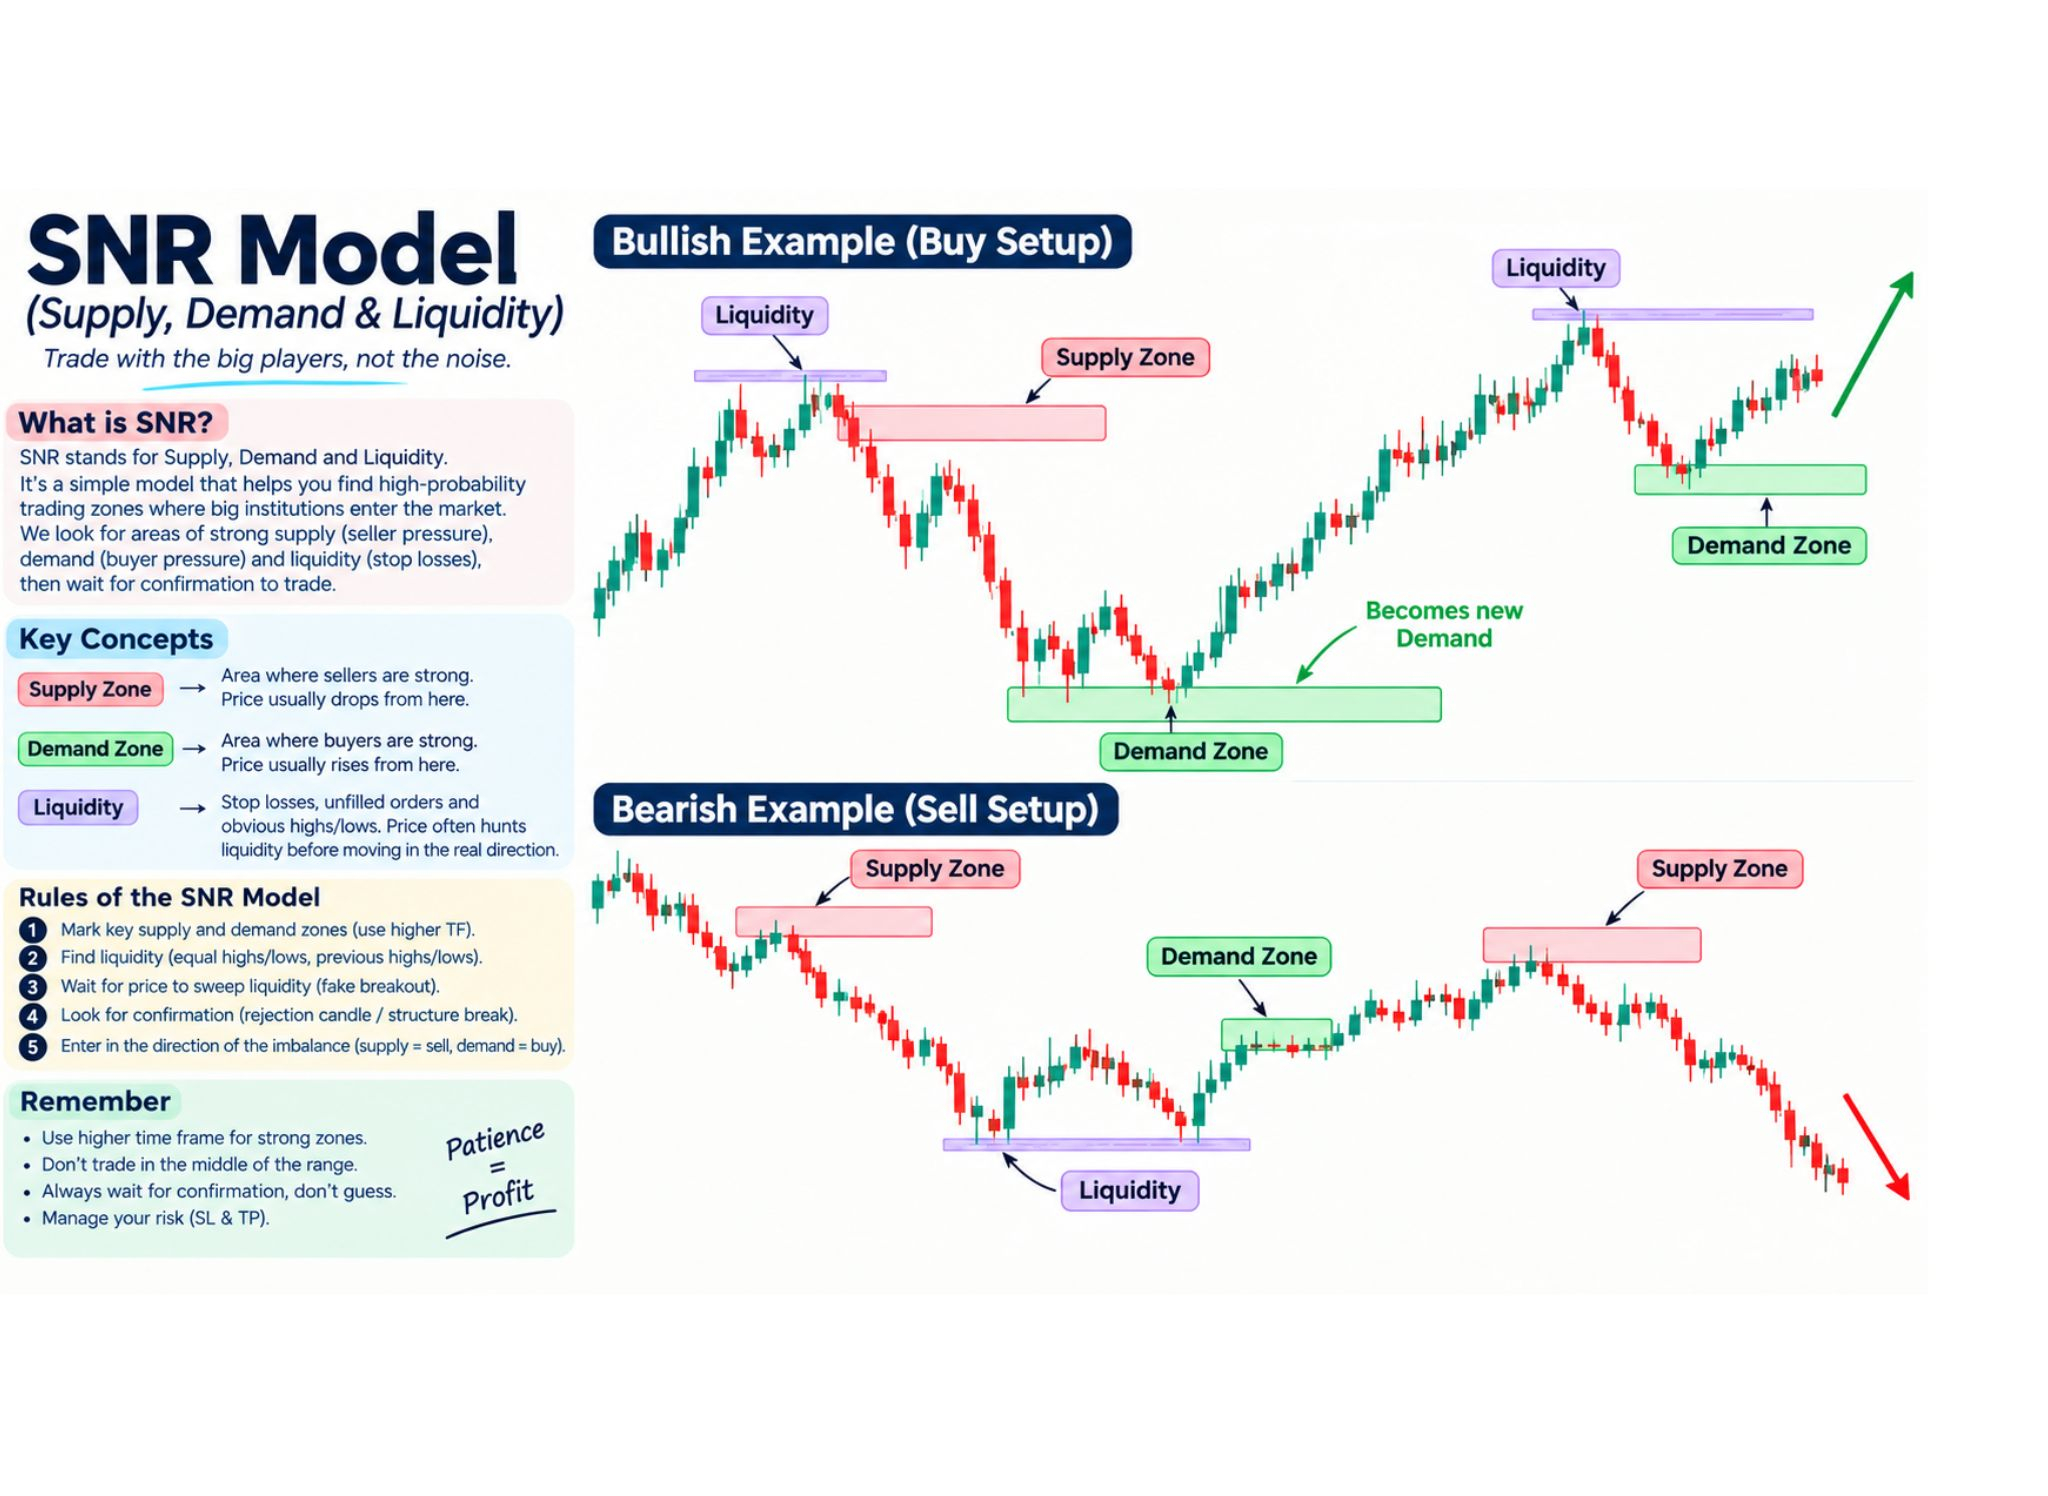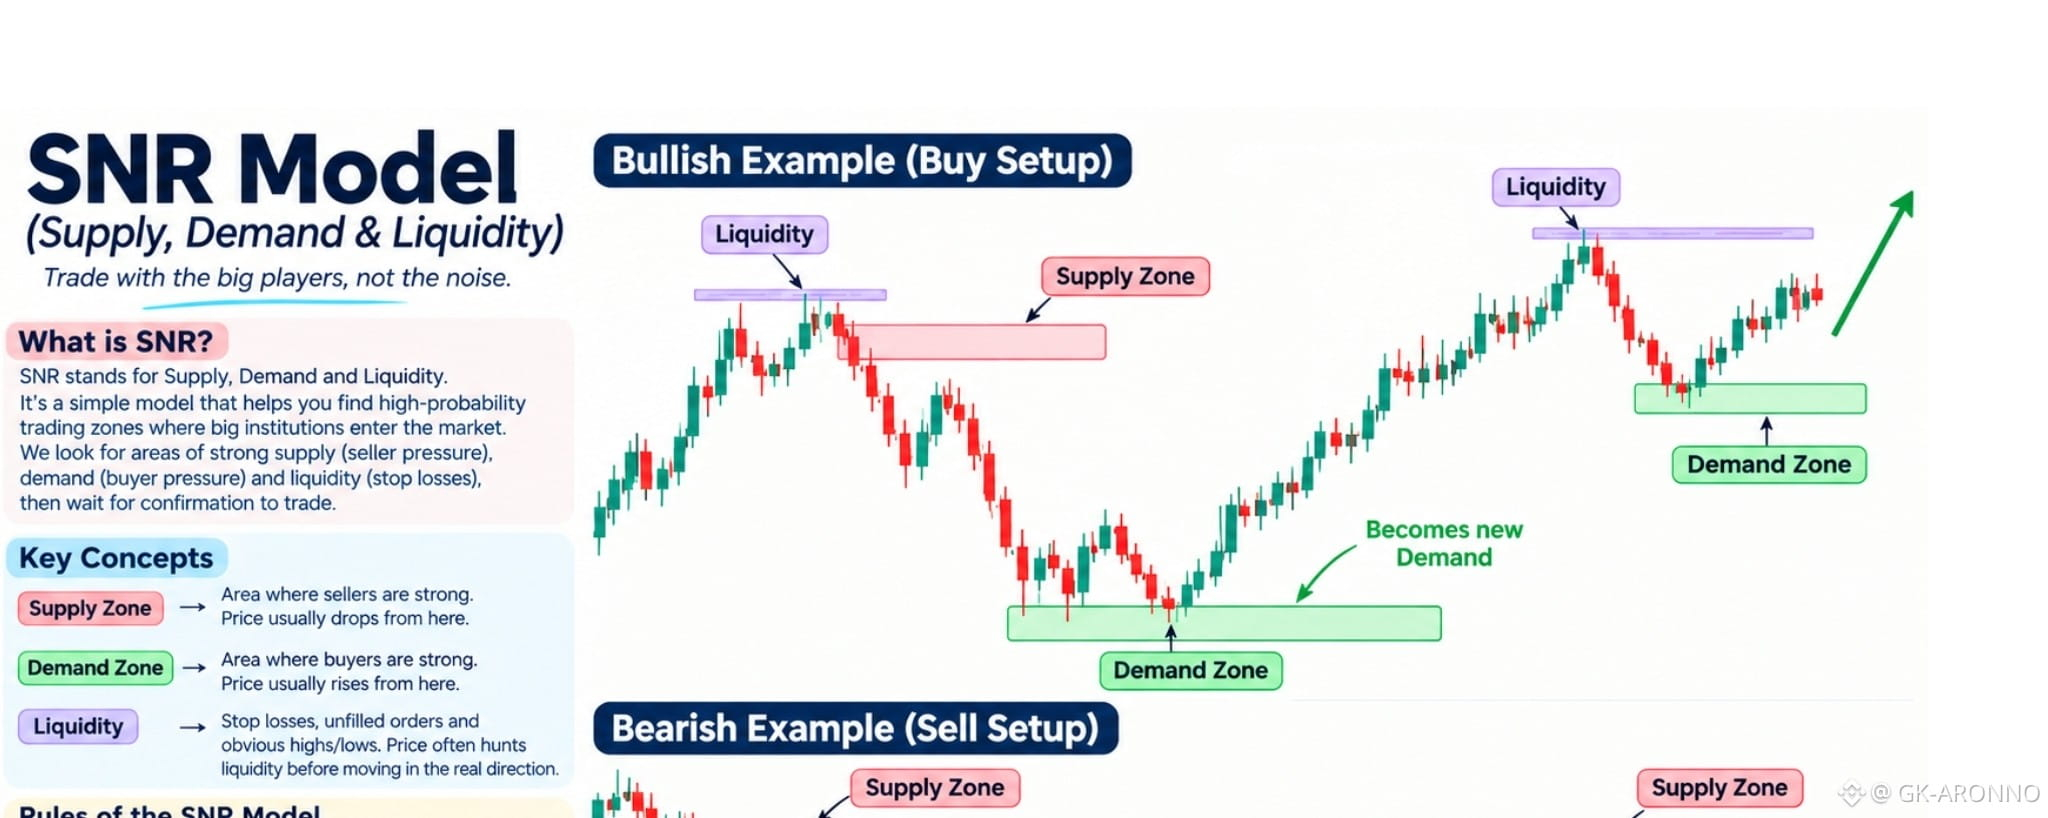

SNR (Supply, Demand & Liquidity) is a simple price-action framework used to identify important areas where buying and selling pressure may appear.
In the examples above, the model focuses on three key elements:
🔴 Supply Zone — An area where strong selling pressure may appear. Price can react or move
lower after returning to this zone.
🟢 Demand Zone — An area where buying pressure may appear. Price can react or move higher
after returning to this zone.
🟣 Liquidity — Areas around obvious highs/lows where stop orders may be concentrated. Price
may sweep these levels before making a stronger move.
📈 Bullish Example
Price first interacts with liquidity and then moves into/around a demand area. After confirmation and a change in market structure, traders can look for a potential buy setup from demand, with the next liquidity or resistance area as a potential target.
📉 Bearish Example
Price reacts around a supply zone while liquidity is taken near previous highs/lows. After bearish confirmation or a structure break, traders can look for a potential sell setup, targeting lower demand/liquidity areas.
🔑 SNR Model Process
1. Identify Supply & Demand → 2. Mark Liquidity → 3. Wait for Liquidity Sweep → 4. Look for
Confirmation → 5. Enter After Confirmation → 6.
Manage RiskManagement Tips
1. Risk only 1–2% per trade
Never put a large portion of your account at risk on one trade. Keep your position size based on your stop-loss distance.
2. Always use a Stop-Loss (SL)
Place your SL at a logical invalidation level, not randomly. Define your SL and Take-Profit (TP) before entering the trade.