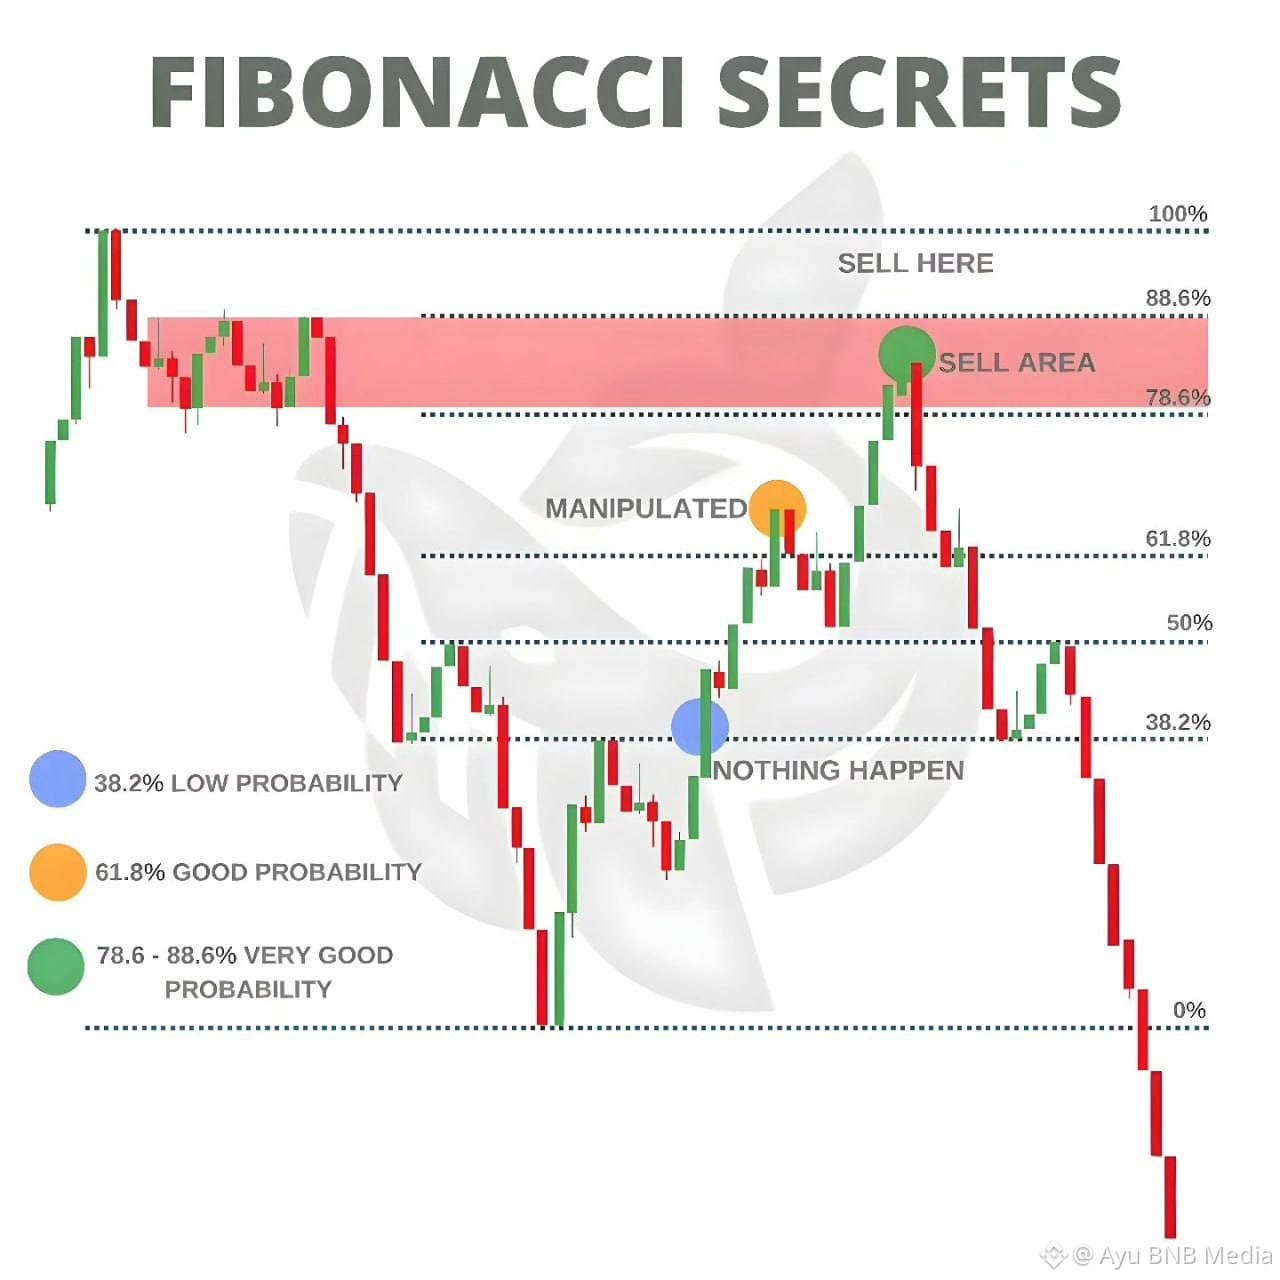
📊 Fibonacci Secrets: Finding High-Probability Reversal Zones
Fibonacci retracement helps traders identify areas where a correction may end and the main trend could resume. But not every Fibonacci level carries the same weight.
🔹 38.2% — Low Probability
A relatively shallow retracement. Price may react here, but the signal is usually weaker without additional confirmation.
🔹 61.8% — Good Probability
One of the most important Fibonacci levels. A strong rejection from this area can signal that the correction is running out of momentum.
🔹 78.6%–88.6% — High-Probability Zone
A deep retracement where price may create a false breakout or liquidity grab before reversing. In the example, price enters this sell area, gets rejected and then continues sharply lower.
⚡️ The key is not to enter simply because price touches a Fibonacci level. Look for rejection, market structure, resistance/support and candlestick confirmation.
Fibonacci retracement helps traders identify areas where a correction may end and the main trend could resume. But not every Fibonacci level carries the same weight.
🔹 38.2% — Low Probability
A relatively shallow retracement. Price may react here, but the signal is usually weaker without additional confirmation.
🔹 61.8% — Good Probability
One of the most important Fibonacci levels. A strong rejection from this area can signal that the correction is running out of momentum.
🔹 78.6%–88.6% — High-Probability Zone
A deep retracement where price may create a false breakout or liquidity grab before reversing. In the example, price enters this sell area, gets rejected and then continues sharply lower.
⚡️ The key is not to enter simply because price touches a Fibonacci level. Look for rejection, market structure, resistance/support and candlestick confirmation.