🚨 HUMA/USDT — LONG SETUP | TRIANGLE BREAKOUT INCOMING? 📈🔥
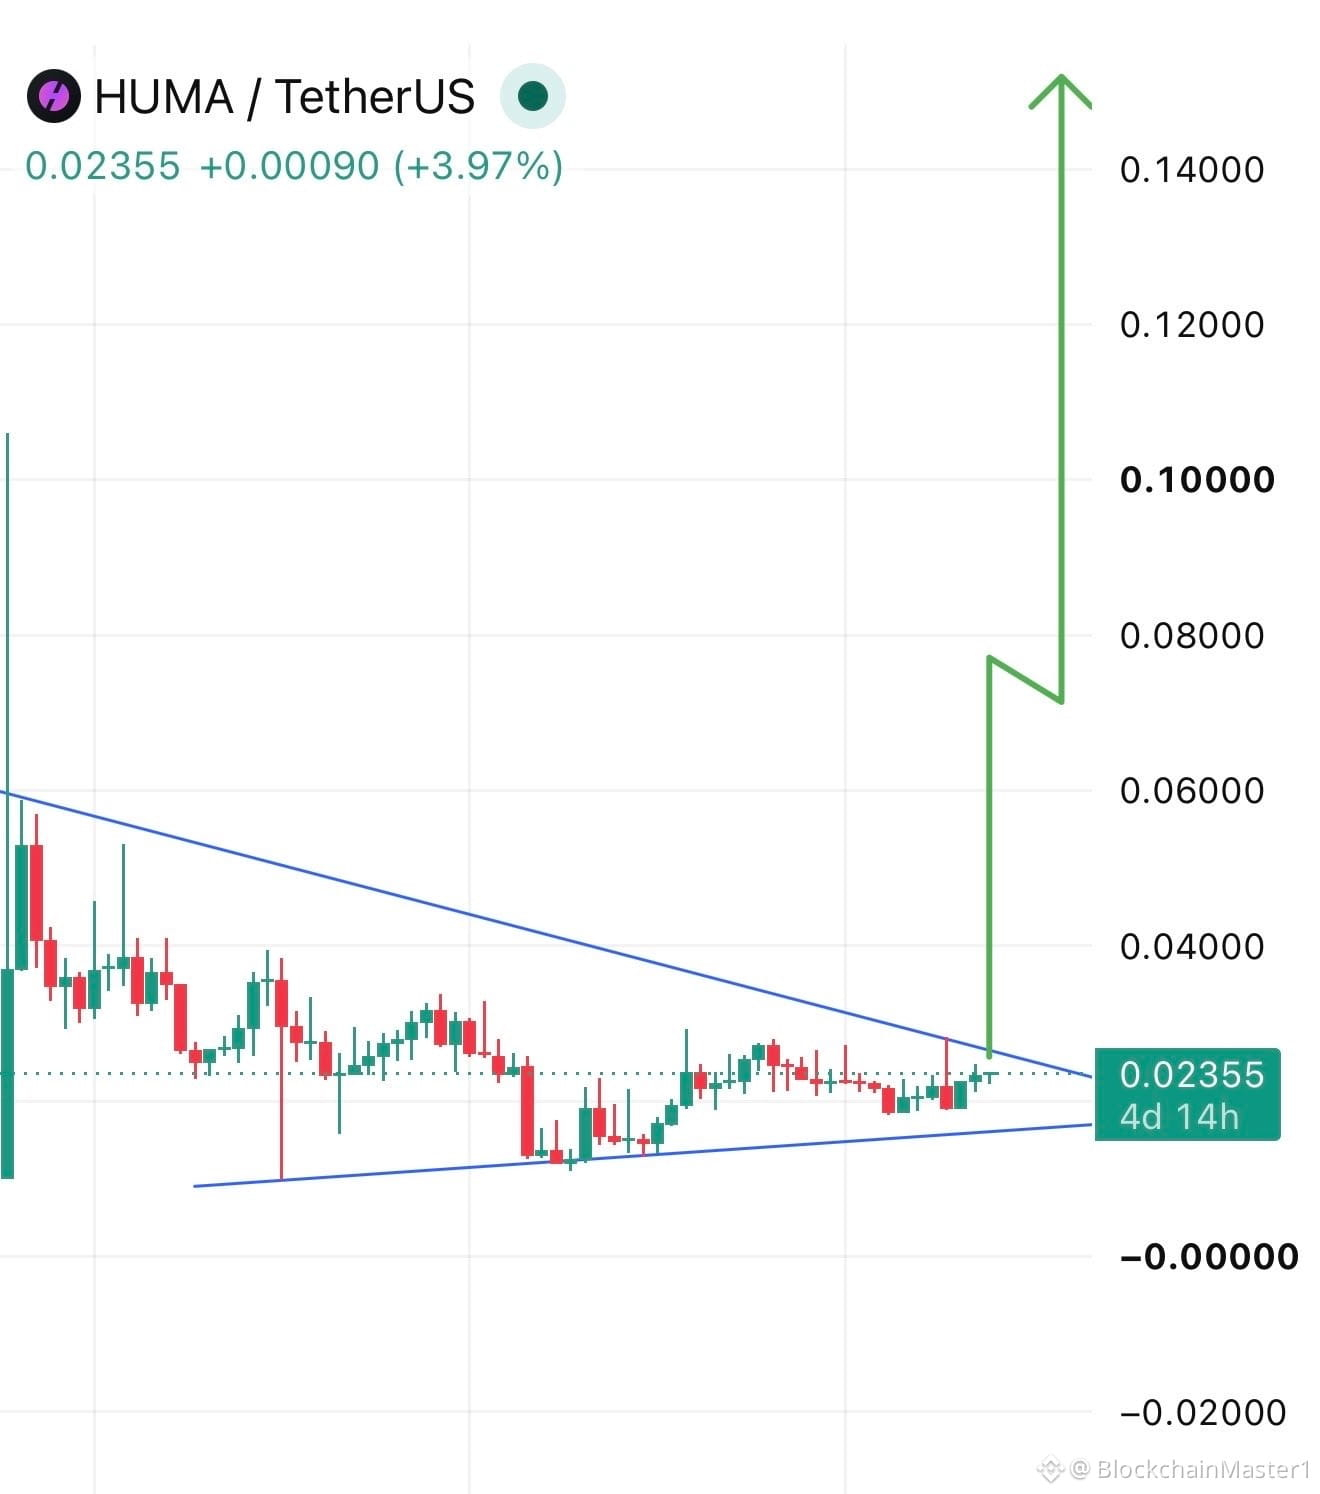
HUMA is trading around $0.02355, up nearly 4% on the chart provided, and price is approaching the upper trendline of a multi-week symmetrical triangle.
This is an important area because HUMA has been compressing between lower support and descending resistance. A confirmed breakout could change the short-term structure and attract fresh momentum.
📊 LONG SETUP
🟢 Entry Zone: $0.0230 – $0.0236
🚀 Breakout Confirmation: Above $0.0247 with strong volume
🛑 Invalidation: Below $0.0215
🎯 TP1: $0.0270
🎯 TP2: $0.0320
🎯 TP3: $0.0400
The $0.0247 area is particularly important because recent HUMA trading reached approximately that level before pulling back. Current market data also shows HUMA around $0.0225–$0.0227, so volatility remains high. �
Bybit +1
The bigger picture is interesting: the triangle is getting tighter, meaning a decisive move could eventually become much larger than the current range.
But patience is important.
❌ If HUMA breaks below $0.0215, the bullish setup becomes invalid and the triangle could break downward instead.
🔥 Bullish scenario: reclaim $0.0247 → momentum expands → $0.027 / $0.032 become the next areas to watch.
⚠️ Bearish scenario: rejection at the upper trendline → price returns toward $0.022–$0.0215 support.
What happens first — HUMA breaks the triangle or gets rejected again? 👀
$HUMA
HUMA is trading around $0.02355, up nearly 4% on the chart provided, and price is approaching the upper trendline of a multi-week symmetrical triangle.
This is an important area because HUMA has been compressing between lower support and descending resistance. A confirmed breakout could change the short-term structure and attract fresh momentum.
📊 LONG SETUP
🟢 Entry Zone: $0.0230 – $0.0236
🚀 Breakout Confirmation: Above $0.0247 with strong volume
🛑 Invalidation: Below $0.0215
🎯 TP1: $0.0270
🎯 TP2: $0.0320
🎯 TP3: $0.0400
The $0.0247 area is particularly important because recent HUMA trading reached approximately that level before pulling back. Current market data also shows HUMA around $0.0225–$0.0227, so volatility remains high. �
Bybit +1
The bigger picture is interesting: the triangle is getting tighter, meaning a decisive move could eventually become much larger than the current range.
But patience is important.
❌ If HUMA breaks below $0.0215, the bullish setup becomes invalid and the triangle could break downward instead.
🔥 Bullish scenario: reclaim $0.0247 → momentum expands → $0.027 / $0.032 become the next areas to watch.
⚠️ Bearish scenario: rejection at the upper trendline → price returns toward $0.022–$0.0215 support.
What happens first — HUMA breaks the triangle or gets rejected again? 👀
$HUMA